Get Indexology® Blog updates via email.

In This List

Mid- and Small-Cap Fund Managers Lost Their Advantage – SPIVA U.S. Mid-Year 2021 Scorecard

The Importance of Order

Global Diversification Trending in India – Time to Notice?

S&P MAESTRO 5 Index: A Sophisticated Composition Designed to Simplify Risk Management

Chugging Along

Mid- and Small-Cap Fund Managers Lost Their Advantage – SPIVA U.S. Mid-Year 2021 Scorecard

Contributor Image
Berlinda Liu

Former Director, Multi-Asset Indices

S&P Dow Jones Indices

The SPIVA® U.S. Mid-Year Scorecard continues to show that active funds’ strong absolute returns do not always translate into relative success compared with their benchmarks. In 15 out of 18 categories of domestic equity funds, the majority of actively managed funds underperformed their benchmarks. Over the 12-month period ending June 30, 2021, 58% of large-cap funds, 76% of mid-cap funds, and 78% of small-cap funds trailed the S&P 500®, S&P MidCap 400®, and S&P SmallCap 600®, respectively.

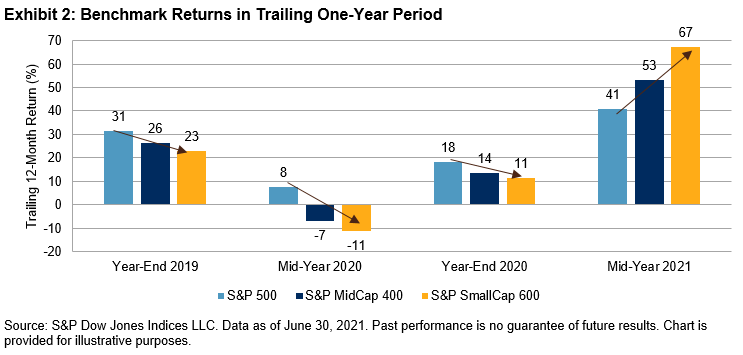
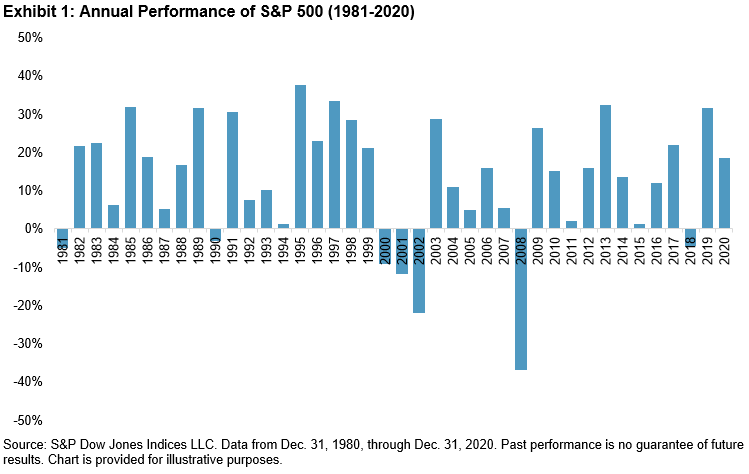
Vast underperformance in the mid- and small-cap segments is particularly interesting in that these active funds managed to do better than their large-cap counterparts in recent reports. Given that their outperformance seemed to occur when the large-cap benchmark had a higher return than the respective mid- or small-cap benchmark (see Exhibits 1 and 2), it is more likely that mid-cap and small-cap fund managers are quietly edging into the larger-cap space and benefiting from the higher returns available there. The re-opening gains of early 2021 add one more data point to that hypothesis. As the rest of the market caught up to the large-cap rally of the initial pandemic phase, mid-cap and small-cap managers who tilted up the capitalization scale were caught leaning in the wrong direction.

This is the first time we included risk-adjusted SPIVA scores in the report. We consider volatility, calculated through the standard deviation of monthly returns, as a proxy for risk, and use return/volatility ratios to evaluate performance. After adjusting for risk, the majority of actively managed domestic equity funds in all categories underperformed their benchmarks on a net-of-fees basis over long-term investment horizons.

The posts on this blog are opinions, not advice. Please read our Disclaimers.

The Importance of Order

Contributor Image
Craig Lazzara

Former Managing Director, Index Investment Strategy

S&P Dow Jones Indices

We all know that stock market returns vary substantially over time. For example, the S&P 500®’s performance between 1981 and 2020 ranged from -37% (2008) to +38% (1995). The market’s compound annual return for this period was 11.5%.

Investors, however, live with actual portfolio values, not abstract rates of return. Obviously, and other things equal, portfolio values will rise with larger contributions and with higher returns. But there is an additional, easily overlooked, source of uncertainty. The market generated a particular set of returns, as shown in Exhibit 1, but those returns occurred in a particular order. If the order had been different, the impact on portfolio values would have been profound. Whether we’re interested in extrapolating into the future or simply in understanding alternative historical outcomes, we need to understand both the average level of returns and the order in which they occurred.

We can illustrate this by considering three alternative scenarios, all using the return data from Exhibit 1. We assume that an investor contributes $1,000 at the beginning of 1981, increasing his investment by 5% every year for 40 years, for a total cumulative contribution of $120,800. For each of our three scenarios, we use the actual returns of a hypothetical investment in the S&P 500, but arrange the order differently. The “Actual Order” scenario shows what would have happened if the returns occurred in exactly the order they did. The “Increasing Return Order” scenario assumes that the worst return came first, then the next-to-worst, and so on until the best return occurred in year 40. The “Decreasing Return Order” scenario makes the opposite assumption; the best return would have occurred first, and the worst in year 40.

For all three scenarios in Exhibit 2, the market’s compound growth rate is the same.  For all three scenarios, the amount and timing of the investor’s hypothetical contributions are the same. And yet the highest hypothetical portfolio value is nearly 18 times greater than the lowest. Clearly, the order in which returns could have occurred matters a great deal. Actual historical performance lies between the two extremes (and is much closer to the lower than to the upper bound).

Exhibit 2 illustrates an important truth: a portfolio outcome depends in part, but only in part, on the returns the market delivers. Portfolio values also depend importantly on the order of returns. Modeling portfolios requires us to deal with both sources of uncertainty.

The posts on this blog are opinions, not advice. Please read our Disclaimers.

Global Diversification Trending in India – Time to Notice?

Contributor Image
Koel Ghosh

Former Head of South Asia

S&P Dow Jones Indices

The merit of international diversification seems to have proven itself lately in the context of the Indian market. Over the past year, interest has increased in adding global exposures to local investment portfolios. Global markets offer the potential opportunity to diversify beyond a traditional concentrated focus on local markets.

The latest August Global Equity Dashboard reflected the upward trend of global equities, with the S&P Global BMI posting a YTD return of 16% and a one-year return of 30%. The S&P Global BMI is an index that is designed to measure more than 11,000 stocks from 25 developed and 25 emerging markets. The S&P United States BMI and the S&P Emerging Europe BMI have had YTD returns of over 20%, which has resulted in increased interest for allocation in those regions. Furthermore, 44 of the 50 country subindices of the S&P Global BMI gained in the last month. The U.S. had the most significant weight, around 57.5%,1 in the S&P Global BMI in terms of country exposure.

Looking at sector performance, Information Technology led in the 3-, 5-, and 10-year periods, while the 1-year period favored Financials (44.87%), Materials (37.86%), and Energy (36.27%). However, the trend shifted YTD, with Energy (23.56%) outperforming and Financials (22.72%) and Information Technology (19.65%) close behind.

The U.S. markets have been gaining popularity in India among other global options. The S&P 500®, the best single gauge of large-cap U.S. equities, has gained popularity among Indian investors. The index posted its seventh straight month of gains in August, climbing 3.0% for the month supported by positive earnings and continued support from the Fed. The options available for global diversification are growing beyond plain vanilla domestic strategies. Thematic, strategy, and sustainable factors are also becoming available to add additional flavor.

India is known for its home bias, but that trend was bucked last year and has continued YTD. Fund of funds investing overseas have grown more than eight-fold since year-end 2019 from INR 2635 crores to INR 21441 crores in August 2021,2 with a 137% growth YTD. While the number of schemes has not increased significantly, the Indian passive market is looking to offer more options for global diversification. The last year has witnessed a host of new passive product filings, with the Securities and Exchange Board of India clearly demonstrating the growing appetite for international investing among local investors.

1 As of Aug. 31, 2021

2 Source : AMFI

The posts on this blog are opinions, not advice. Please read our Disclaimers.

S&P MAESTRO 5 Index: A Sophisticated Composition Designed to Simplify Risk Management

Get to know the S&P MAESTRO 5 Index, a diversified, multi-asset, multi-factor risk parity strategy designed to help investors hit the right notes across a range of market conditions.

The posts on this blog are opinions, not advice. Please read our Disclaimers.

Chugging Along

Contributor Image
Fei Mei Chan

Former Director, Core Product Management

S&P Dow Jones Indices

In the last three months, the Canadian equity market climbed another three percentage points, bringing the S&P/TSX Composite Index up to an impressive 20.4% YTD through Sept. 16, 2021. In a strong bull market environment, low volatility indices are expected to lag—and they typically have. But overall, the S&P/TSX Composite Low Volatility Index has held its own, gaining 18.8% YTD, just a 1.6% shortfall.

It’s perhaps also no surprise that one-year volatility levels continue to decline (across all GICS® sectors). Health Care remains the most volatile sector, with Information Technology close behind.

The S&P/TSX Composite Low Volatility Index seeks out the lowest volatility at the stock level, but we often look to sector volatility for insights into the dynamics that drive allocations within the index.

The latest rebalance for the S&P/TSX Composite Low Volatility Index was effective following the close of trading on Sept. 17, 2021. Changes in the index were minimal, but that’s not surprising given what we’ve seen in the sector volatility changes. Financials, Real Estate, and Utilities continue to add weight in the index and are the three largest sectors. Most of the increase came at the expense of Industrials, whose weight declined to 7% from 13%. Health Care, which represents 1% of the S&P/TSX Composite, has no weight in the low volatility index.

The posts on this blog are opinions, not advice. Please read our Disclaimers.