Get Indexology® Blog updates via email.

In This List

Riding the Value Wave

Getting Dynamic with Commodities – Part 1

The Potential Value of U.S. Equity Allocation to Chinese Investors

What Canada Is Missing

High Levels of Dispersion across the Commodities Complex in May

Riding the Value Wave

Contributor Image
Craig Lazzara

Former Managing Director, Index Investment Strategy

S&P Dow Jones Indices

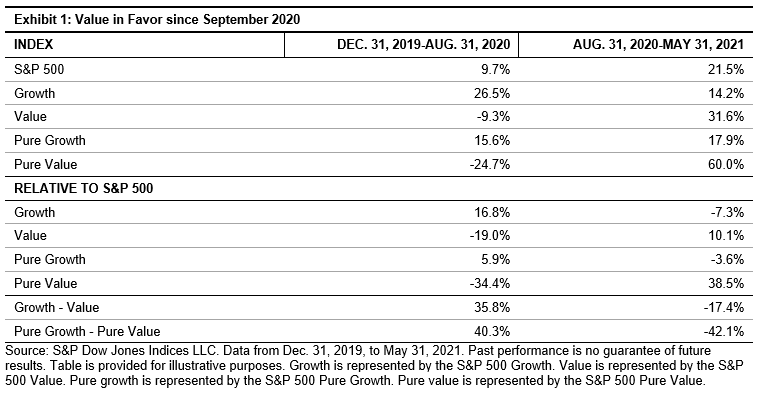
U.S. equity markets seemed to undergo a fundamental change of direction in September of last year. Exhibit 1 illustrates the shift; our growth indices, which had outperformed value handily through the end of August, have lagged ever since. The spreads between growth and value are even greater when we compute them using our Pure Growth and Pure Value indices.

Do the strength and longevity of the value rally suggest that it must be near its peak?

To answer directly—we don’t know. Whether value continues to outperform growth or suffers a reversal is a function of numerous exogenous variables, prominently including the course of inflation, the level of interest rates, and the prospects for growth as the economy recovers from last year’s shutdowns. History does, however, let us make two observations about the nature of past value rallies.

First, as Exhibit 2 illustrates, some historical value rallies have lasted far longer than nine months. Since 1995, there have been six cycles when value outperformed growth. The shortest lasted only six months (between February and August 2009). On the opposite side of the ledger, value outperformed for more than four years between 2003 and 2007. So the nine-month duration of the current rally is meaningless in itself.

Second, when value has outperformed historically, its outperformance has accrued smoothly. Exhibit 3 illustrates this for the 2003-2007 value rally, although similar graphs could be (and have been…) drawn for the other periods of value dominance. It’s conceptually possible that, although value outperformed for more than four years, most of the outperformance occurred in the early months, with only a small dollop for latecomers. It turns out that this was not the case; early investors did not reap a disproportionate share of value’s gains.

We don’t know for how much longer value will outperform growth. We don’t know what the ultimate margin of outperformance will be. But the current nine-month cycle is not remarkably long by historical standards, and if it keeps going, history gives us reason to believe that outperformance in the next period can be as good as it was initially.

The posts on this blog are opinions, not advice. Please read our Disclaimers.

Getting Dynamic with Commodities – Part 1

Contributor Image
Jim Wiederhold

Former Director, Commodities and Real Assets

S&P Dow Jones Indices

Launched just over 10 years ago, the S&P GSCI Dynamic Roll was the first dynamically rolling commodity futures index to be offered by a major index provider. What does it mean to dynamically roll? Exhibit 1 describes the process in detail. Employing a flexible monthly futures contract rolling strategy, the S&P GSCI Dynamic Roll is designed to alleviate the negative impact of rolling into contango, to benefit from backwardation, and potentially to lessen volatility while offering investors liquid, broad-based commodity exposure. Contango and volatility are the most cited reasons why market participants tend to steer away from commodities, despite the potential inflation protection and diversification benefits of including commodities in a diversified portfolio. The S&P GSCI Dynamic Roll may help to mitigate these concerns.

Roll yield or carry can add or detract from commodity returns. Any commodity investment product that uses commodity futures as the underlying instrument must continually reinvest, or roll, from expiring nearer-dated contracts into longer-dated contracts to maintain uninterrupted exposure to the respective commodity. If the futures curve is upward sloping (in contango), the roll yield will be negative. If the futures curve is downward sloping (in backwardation), the roll yield will be positive. When the futures curve is in contango holding a position further along the futures curve at a point where the curve is less steep, the negative carry is reduced each time the position is rolled, as opposed to staying in the most near-dated contracts with the steepest contango structure. Exhibit 2 illustrates the steep contango we witnessed in the crude oil market at the start of the pandemic lockdowns in 2020. The S&P GSCI Dynamic Roll was further out on the curve (yellow) than a typical near-dated exposure (navy), where the contango was steepest, thereby reducing the impact of the negative roll yield. In contrast, in March 2021, the crude oil market was in backwardation, and it was advantageous for investors to hold positions at the front of the futures curve.

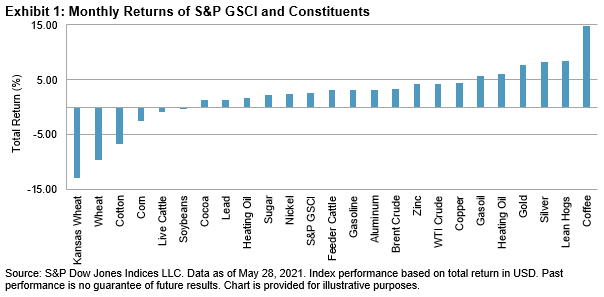
With many of the 24 commodity constituents of the S&P GSCI in backwardation in 2021, a positive catalyst in the form of a positive roll yield is one of the current reasons to look at commodity exposure. After years of negative roll yields, investors are being rewarded for holding commodity exposure. The S&P GSCI Dynamic Roll is designed to benefit from backwardation by holding positions at the front of the futures curve.

With the contango situation explained, we’ll move on to the volatility in commodities. As we’ve discussed in several prior blogs,1 commodities are typically the most volatile asset class, leading some risk-averse market participants to stay away. The S&P GSCI Dynamic Roll is designed to be able to hold positions further down the futures curve, limiting exposure to more volatile, near-dated or spot prices. Exhibit 3 illustrates the historical performance of the S&P GSCI Dynamic Roll versus the headline S&P GSCI and other popular alternative commodity beta indices.

Looking for a broad-based, long-only commodity benchmark this year? The S&P GSCI Dynamic Roll may be a better, less-volatile way to gain commodity exposure in 2021. Check out our new Commodities theme page for more information on our indices and timely research to deepen your knowledge of commodities.


1 https://www.indexologyblog.com/category/commodities/#categories

The posts on this blog are opinions, not advice. Please read our Disclaimers.

The Potential Value of U.S. Equity Allocation to Chinese Investors

Contributor Image
Jason Ye

Director, Factors and Thematics Indices

S&P Dow Jones Indices

The Chinese financial market has continued to evolve and mature over the past decade. More and more domestic Chinese investors are starting to take note of investment opportunities from global markets. What are the potential benefits of allocating globally for Chinese investors? In this blog, we will use the CSI 300 Index as a proxy for the China A-shares equity market and the S&P 500® as a proxy for the U.S. equity market to illustrate that investing globally may provide diversification benefits and could improve risk-adjusted return.

Diversification

As long as two assets are not perfectly correlated, combining them may reduce a portfolio’s overall standard deviation, a common measure of risk.

Despite rising in recent years, the historical correlation of returns between China A-shares and U.S. equity markets has generally been below 0.5 (see Exhibit 1). The low correlation suggests a potential reduction in portfolio volatility when adding U.S. equities to a portfolio of only China A-shares.

Risk-Adjusted Return

On a rolling 10-year basis from Dec. 31, 1994, to March 31, 2021, the U.S. market had a higher risk-adjusted return than the China A-shares market during most periods.

This is driven primarily by different volatility levels observed in the two markets. The China A-shares market was significantly more volatile than the U.S. market, despite a meaningful downward trend in volatility over the past five years.

Looking at absolute return, the U.S. and A-shares markets showed distinct cycles. The average rolling 10-year return for China A-shares was 8.42%, versus 6.98% for U.S. equities.

BLENDING THE CSI 300 INDEX AND S&P 500

Exhibits 3a and 3b show the historical risk/return profiles of hypothetical blended indices created from combinations of the CSI 300 Index and S&P 500 ranging in 10%-20% increments, assuming a monthly fixed-weight rebalance. In the past 3, 5, and 10 years, a hypothetical blended index with weighting to the S&P 500 not only reduced the blended index’s standard deviation but also increased the annualized compounded performance.

Between 2005 and 2020, increasing weights to the S&P 500 improved risk-adjusted returns for the blended index; the reduction in standard deviation more than offset the impact of lower performance. The in-sample optimal allocation of 77% U.S. and 23% China A-shares in the blended index generated a risk-adjusted return of 0.75, higher than both the standalone S&P 500 (0.67) and CSI 300 Index (0.47).

CONCLUSION

Historically, Chinese investors’ allocation to global equities, including U.S. equities, has been low. By underallocating to U.S. equities, Chinese investors have less diversification. Increasing exposure to the U.S. equity market may result in improved risk-adjusted return for Chinese investors. For more details, please refer to Why the S&P 500 Matters to China.

The posts on this blog are opinions, not advice. Please read our Disclaimers.

What Canada Is Missing

Contributor Image
Tim Edwards

Managing Director, Index Investment Strategy

S&P Dow Jones Indices

Canadian investors have long participated in U.S. equity markets, but are materially underweight in U.S. mid- and small-cap companies.

In this respect, Canadians resemble their European counterparts, whose investments in the U.S. rarely range beyond those companies included in the S&P 500®. This underinvestment is surprising for several reasons. European market participants are no stranger to U.S. equities, nor the case for global diversification, and small- and mid-cap U.S. stocks compose, in aggregate, a significant segment within the global equity opportunity set. Last but not least, S&P DJI’s U.S. small- and mid-cap indices—the S&P SmallCap 600® and the S&P MidCap 400®—have outperformed the more internationally-famous S&P 500 since their launch in the 1990s; typically no deterrent to fund flows. Canadians show a similar, if somewhat less extreme, hesitancy in venturing beyond blue chips.

Exhibit 1 illustrates the estimated relative weights of various geographic and U.S. size segments in the global equity market and Canadian fund market. The left-hand chart shows weights in the S&P Global BMI, a broad-based gauge of developed and emerging equities. On the right, we combined assets under management in Canadian equity funds to estimate aggregate allocations to the same segments.

Like their counterparts across the Atlantic (and other oceans), Canadian investors demonstrate a “home bias”. Notwithstanding this common and, some argue, quite rational feature of international portfolios, Exhibit 1 illustrates that Canadians are quite comfortable investing in their neighbor’s exchanges, with an aggregate allocation to U.S. large caps of 37%, versus a market weight of 39%.

However, in aggregate, the small- and mid-cap segments only received an aggregate allocation of 5%, less than one-third of the global weight of 17%. Mid caps were most underweighted in absolute terms, with a 7% difference between Canadian and market weights, but smaller companies were the more underweighted in relative terms, with a 1% allocation to U.S. small caps versus a 6% global weight.

One factor that could explain the historical lack of international participation in U.S. mid- and small-cap segments is that investors’ performance may not have been as good as that of S&P DJI’s benchmarks. Smaller stocks are more expensive to trade, and the in-category record of active managers has been relatively poor over the past decades. However, an alternative is now available. With index funds for U.S. mid- and small-cap segments developing track records across global markets, including in Canada, a broader range of market participants may feel comfortable accessing this previously overlooked source of returns.

If you’d like to dig deeper into the topic, I’ll be presenting this research along with some related thoughts at an upcoming S&P DJI webinar for Canadian professional investors. Experts from the fund management and advisor industries will also be there to discuss efficient access to U.S. equity markets beyond the blue-chip names, and whether the forward returns of smaller stocks might be expected to help diversify or damage Canadian investor portfolios. The sign-up link is here

Note: Thanks and credit for Exhibit 1 are due to Sherifa Issifu, co-author on the earlier European work.

The posts on this blog are opinions, not advice. Please read our Disclaimers.

High Levels of Dispersion across the Commodities Complex in May

Contributor Image
Fiona Boal

Managing Director, Global Head of Equities

S&P Dow Jones Indices

At the headline level, it was a rather subdued month for commodities. The S&P GSCI gained 2.5%, taking YTD performance to 26.0%. While the S&P GSCI’s upward momentum attenuated, high dispersion in the performance of single commodities continued, albeit with reversals among the leaders and laggards. Most of the grains sagged to the bottom of the performance table after surging in April, while feeder cattle, silver, and gold switched ends of the table. Coffee offered an exception, with caffeine-boosting double-digit gains in both periods.

A more positive demand story across the U.S. and parts of Europe supported the petroleum complex in May. The S&P GSCI Petroleum gained 4.2% over the month. According to OPEC+, the oil glut built up during the COVID-19 pandemic has almost been depleted and stockpiles will decline swiftly in the second half of the year. Following various courtroom and boardroom defeats for Western oil companies in the name of cutting carbon emissions in May, OPEC and its allies could be afforded additional influence over global oil supplies in the years ahead.

News that Chinese regulators would show zero tolerance for monopolistic behavior or inventory hoarding in commodities markets did little to cool industrial metals prices in May. The S&P GSCI Industrial Metals rose 3.7%, while the S&P GSCI Copper gained 4.4%. Industrial metals continue to benefit from the world’s largest economies building back greener from the COVID-19 shock, while miners and investors remain reluctant to expand supply, despite the surge in prices. In the end, Beijing’s focus on curbing speculation may do little more than reduce liquidity on the local exchanges and reduce onshore metal stockpiles, which could have the unintended impact of putting upward pressure on prices in an already tight market.

It was a good month for precious metals. The S&P GSCI Precious Metals rallied 7.7%, as market participants switched their focus back to the risk of inflation and the U.S. dollar fell. The S&P GSCI Gold hit a near five-month high at the end of May, benefiting from a rebound in demand for jewelry, bars, and coins in China.

The S&P GSCI Agriculture finished the month down 3.2%. The complex was hit by a reversal in fortune across the grain markets, with corn and wheat ending the month notably lower. Rumors of China cancelling U.S. corn cargoes or limiting exports rocked the market, which until recently had enjoyed an impressive multi-month rally following an abrupt tightening of global corn supplies. It was a similar story in wheat; the S&P GSCI Kansas Wheat fell 12.8% over the month.

The S&P GSCI Livestock gained 3.2% in May. A fall in feed costs helped lean hog and feeder cattle prices, while lean hogs also benefitted from strong wholesale pork demand and tight supplies of market-ready hogs.

The posts on this blog are opinions, not advice. Please read our Disclaimers.