Get Indexology® Blog updates via email.

In This List

Dissecting the Performance of Indian Equity Active Funds in 2020

Woodstock for Capitalists

Seeking Sustainable Dividends in Global Markets – Introducing the Dow Jones International Dividend 100 Index (Part 2)

Seeking Sustainable Dividends in Global Markets – Introducing the Dow Jones International Dividend 100 Index (Part 1)

Expanding the Non-USD Denominated S&P GSCI Single Commodity Index Series

Dissecting the Performance of Indian Equity Active Funds in 2020

Contributor Image
Arpit Gupta

Former Senior Analyst, Global Research & Design

S&P Dow Jones Indices

The percentage of active funds that underperformed their respective benchmarks in the Indian Equities Large-Cap and Mid-/Small-Cap fund categories over a one-year investment horizon doubled from 2019 to 2020, as seen in the SPIVA® India Year-End Scorecards for 2019 and 2020. The percentage of Large-Cap active funds that underperformed the S&P BSE 100 over a one-year investment horizon increased from 40% (in 2019) to 80.65% (in 2020). During the same period, the percentage of funds in the Mid-/Small-Cap category that underperformed the S&P BSE 400 MidSmallCap Index increased from 27.91% (in 2019) to 66.67% (in 2020).

A drag in active fund performance (relative to the benchmark) could result from multiple reasons, including  adverse stock selection and sector allocation, unfavorable investment style, or failing to time market trends and turning points. In this blog, we evaluated the return betas of active funds to investigate as a potential reason that may have led the majority of Indian Equity Large-Cap funds and Indian Equity Mid-/Small-Cap funds to underperform in 2020.

In 2019 and 2020, the benchmark for Indian Equity Large-Cap funds, the S&P BSE 100, returned 10.92% and 16.84%, respectively. Only 40% of active funds in this category underperformed the benchmark in 2019, but over 80% lagged in 2020 (see Exhibit 1). The large-cap active funds had an aggregate category beta of 1.02 in 2019, which was higher than the 0.96 recorded in 2020 (see Exhibit 2). We noticed a much higher number of Indian Equity Large-Cap fund managers with beta less than 1 in 2020 than in 2019 (see Exhibit 3). Due to the COVID-19 pandemic, many active large-cap fund managers might have positioned their portfolios with higher allocation to cash or low beta stocks to avoid market volatility or drawdown, which would have hurt their relative performance during market recovery in the latter part of 2020.

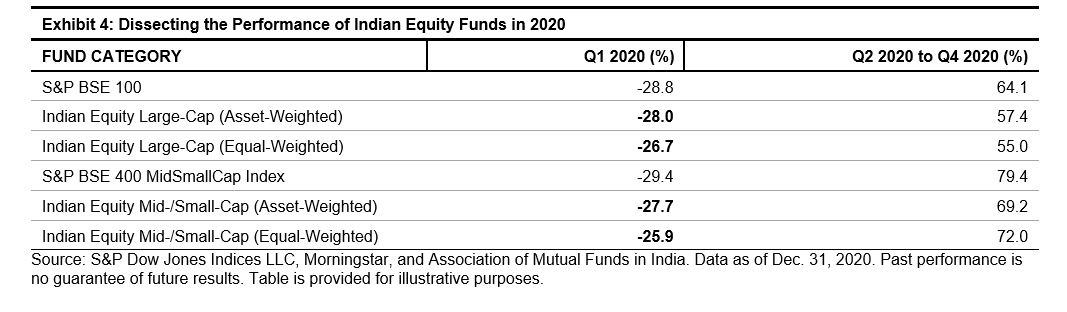
By dissecting the benchmark and fund returns during the market decline and recovery in 2020, it was obvious that the low beta allocation in large-cap funds affected their relative performance in opposite manners during the two periods. In Q1 2020, the S&P BSE 100 lost 28.8%, whereas Indian Equity Large-Cap active funds, with lower aggregate beta, suffered a slightly lower drawdown of -28.0% and -26.7% in their asset-weighted and equal-weighted average returns, respectively (see Exhibit 4). In contrast, when the market rallied during the latter nine months of 2020, active funds gained much less than the S&P BSE 100 (64.1%) across asset- and equal-weighted returns (57.4% and 55.0%, respectively).

For Indian Equity Mid-/Small-Cap funds, we noticed low aggregate category beta (<1) in both 2019 (0.87) and in 2020 (0.94). Over 86% and 83% of Indian Equity Mid/Small-Cap funds had beta less than 1 in 2019 and 2020, respectively. Low beta allocation in mid-/small-cap funds effectively avoided or reduced drawdown for many funds in 2019, with only 27.9% of Indian Equity Mid-/Small-Cap funds underperforming the S&P BSE 400 MidSmallCap Index (which was down by 2.1%). However, in 2020, the continuation of low beta allocation by active mid-/small-cap fund managers were penalized when the benchmark recorded a strong gain of 26.76%, resulting in over 66.67% of Indian Equity Mid-/Small-Cap funds lagging the benchmark in 2020.

As observed in the Indian Equity LargeCap fund category, low beta allocation affected the Indian Equity Mid-/Small-Cap funds’ performance differently during market sell-off and rally. In Q1 2020, the S&P BSE 400 MidSmallCap Index dropped 29.4%, while the Indian Equity Mid-/Small-Cap funds marked a smaller drawdown of 27.7% and 25.9% in asset- and equal-weighted returns, respectively. But for the rest of the nine-month period in 2020, the Indian Equity Mid-/Small-Cap funds lagged the benchmark index by 10.2% and 7.4% on an asset- and equal-weighted basis, respectively.

When active managers tailor the risk exposures of their portfolios, the success largely depends on their market-timing skills, which can be challenging, especially during volatile times. Low beta portfolio allocation for the Indian Equity Large-Cap and Mid-/Small-Cap stocks penalized more than helped their overall benchmark-relative performance in 2020, which reflected the difficulties in estimating the timing and size of market recovery from the pandemic crisis. This could explain why an increasing number of market participants shifted their preference toward passive investing, which provides plain vanilla market exposure at a competitive cost.

The posts on this blog are opinions, not advice. Please read our Disclaimers.

Woodstock for Capitalists

Contributor Image
Craig Lazzara

Former Managing Director, Index Investment Strategy

S&P Dow Jones Indices

Berkshire Hathaway is scheduled to hold its annual shareholders’ meeting this Saturday, May 1. This is the second consecutive year in which the meeting will be virtual; in 2019, attendance was nearly 40,000, which makes social distancing somewhat difficult.

We noted two years ago that Berkshire’s investment performance, though formidable over the long run, had lately become more pedestrian. Neither conclusion has changed in the interim. $100 invested in Berkshire stock at the end of 1968 would have grown to more than $960,000 by the end of 2020; a comparable investment in the S&P 500® would have grown to $16,800.

Berkshire’s wealth generation has been all the more remarkable for having occurred at a time when most active portfolio managers underperformed index benchmarks. To cite the most recent evidence from our SPIVA® reports, in the 20 years ending in 2020, 94% of all large-cap U.S. managers lagged the S&P 500. Mid- and small-cap results were almost equally disappointing.

Despite the historical magnitude of Berkshire’s excess returns, they have recently been on a downtrend. Our comparison of Berkshire and the S&P 500 spans 52 years, or 43 (overlapping) 10-year windows. In the first 22, Berkshire beat the S&P 500 by an average of more than 17% per year. In the next 21 windows, Berkshire’s outperformance averaged 3.4%. The margin hit double digits for the last time in 2002. For the 10 years ending in 2020, Berkshire Hathaway lagged the S&P 500 by 2.4% annually.

What’s gone wrong? The Berkshire portfolio is still being guided by Warren Buffett and Charlie Munger, whose abilities show no sign of deterioration with age, so that’s unlikely to be the source of the problem. Instead, the decisive variable is the improved quality of the competition. Mr. Munger himself (currently 97 years old) acknowledges that “we had idiot competition when we were young.”

In the game of professional investment management, the only source of outperformance for the winners is the underperformance of the losers. As the underperformers lose assets, either to passive funds or to more-capable active managers, the surviving active managers become better, and outperformance is harder to achieve.

When Warren Buffett was asked several years ago whether Berkshire or the S&P 500 would be the better investment for a long-term investor, he suggested that “the financial result would be very close to the same.” When the premier active investment manager in modern financial history says that, you know that active management is a hard game—and getting harder.

The posts on this blog are opinions, not advice. Please read our Disclaimers.

Seeking Sustainable Dividends in Global Markets – Introducing the Dow Jones International Dividend 100 Index (Part 2)

Contributor Image
Qing Li

Director, Global Research & Design

S&P Dow Jones Indices

Since its index inception on March 31, 2005, the Dow Jones International Dividend 100 Index has delivered significant outperformance, on a total return basis, over the broader market, as represented by the Dow Jones Global ex-U.S. Index.

The Dow Jones International Dividend 100 Index generated an annualized return of 8.82%, compared with 6.05% from the global ex-U.S. index (see Exhibit 1). Taking volatility into consideration, the risk-adjusted returns from the Dow Jones International Dividend 100 Index exceeded the benchmark across the long- and short-term history. During the 15-year horizon, the Dow Jones International Dividend 100 Index provided a risk-adjusted return of 0.55, which is 104% higher than the benchmark.

The Dow Jones International Dividend 100 Index has displayed defensive characteristics in volatile markets. Shown in Exhibit 2, the index beat the broader market during the five most-severe drawdown periods, creating an average excess return of 6%. We calculated capture ratios to see how the index performed during the upside and downside markets. Overall, the index captured 78% of the downtrend markets, meaning it suffered less loss than the broader market, as it would decline 7.8% when the benchmark is losing 10%. The index participated in most of the uptrend markets, with an upside capture ratio of 91%.

In addition to the solid outperformance seen in various market conditions, the Dow Jones International Dividend 100 Index provided sustainable dividend income in global markets. The dividend yield has stayed above 3% and averaged 4.33% (see Exhibit 3) over the past 15 years.

The posts on this blog are opinions, not advice. Please read our Disclaimers.

Seeking Sustainable Dividends in Global Markets – Introducing the Dow Jones International Dividend 100 Index (Part 1)

Contributor Image
Qing Li

Director, Global Research & Design

S&P Dow Jones Indices

Dividend strategies appeal to investors for various reasons. High-dividend-yield strategies can offer generous income, while dividend growth strategies tend to emphasize the quality of dividends. The Dow Jones International Dividend 100 Index, launched in March 2021, seeks to provide global exposure to both high dividend yield and dividend growth.

Here we review the methodology of this index’s construction. The Dow Jones International Dividend 100 Index is comprised of non-U.S. large- and mid-cap companies that exhibit consistent dividend payout history, strong fundamentals, and relatively low volatility. Exhibit 1 outlines the key process of the index construction, which involves multi-layered screens to incorporate various factors.

The initial universe consists of the large- and mid-cap issues1 from the Dow Jones Global ex-U.S. Index. Additional parameters (see Exhibit 2) are applied to form a selection universe.

After this screening, only the securities whose indicated dividend yields ranked among the top half of those considered are qualified for further financial health evaluation. The subsequent measurement is a composite score combining cash flow-to-debt, return on equity (ROE), indicated dividend yield, and the five-year dividend growth rate.

Cash flow-to-debt indicates the efficiency level of a company in producing cash to cover its debt. As a profitability ratio, ROE signifies how well a company is using its shareholders’ capital, and a company with higher ROE is more capable of cash generation. The use of indicated dividend yield reflects expected income2 rather than realized income that an investor will receive. While indicated dividend yield represents cash income, dividend growth rate helps determine if a company can sustain its long-term dividend distribution. We define the dividend growth rate as the percentage rate of growth of a company’s annualized dividend per share over the past five years. Analyzing these fundamentals can help investors gauge a company’s financial health.

The composite score is calculated as the average rank of the four fundamental-based factors. A high composite score means a company is financially healthy. Based on the composite score, the top 400 securities are selected for volatility screen, where volatility is calculated as the three-year price volatility in USD. The initial portfolio is formed with the top 100 ranked stocks whose volatilities are less than or equal to the median volatility of the 400 top-scoring stocks.

The index is float-market-cap weighted, with various weight constraints to reduce concentration risk. During the annual March rebalancing and quarterly updates, the weightings are evaluated to ensure that a security only represents a maximum 4% of the index, each of the Global Industry Classification Standard (GICS®) sectors are capped at 15%, and the emerging market exposure is limited at 15%. In addition, the index is subject to a daily weight cap check when the sum of the stocks whose weights are greater than 4.7% exceeds 22%.

To reduce turnover, buffer rules3 that favor the existing index members are applied in multiple layers during the selection process, including buffer zones on size, country weight, indicated dividend yield, volatility, and count.

The Dow Jones International Dividend 100 Index adds a multi-level process to the rule-based framework. In our next blog, we will analyze how this index has performed.


1 REITs are excluded. For China, only the shares that trade in developed markets are eligible.

2 Using Trailing Dividend Yield Versus Indicated Dividend Yield

3 Please refer to the Dow Jones Dividend Indices Methodology for details.

The posts on this blog are opinions, not advice. Please read our Disclaimers.

Expanding the Non-USD Denominated S&P GSCI Single Commodity Index Series

Contributor Image
Jim Wiederhold

Former Director, Commodities and Real Assets

S&P Dow Jones Indices

Concerns of a rising U.S. dollar may pose a hindrance to initiating commodity exposure from outside the U.S. Most commodities around the world are priced in U.S. dollars, so when the value of the U.S. dollar rises, the value of commodities typically falls. The launch of new non-U.S.-dollar-denominated S&P GSCI Single Commodities Indices could help commodity exposure seekers gain access while alleviating the external currency risk. Exhibit 1 shows the newly expanded universe of the S&P GSCI Single Commodities Index offerings. These indices are designed to track commodities from exchanges outside of the U.S. and are priced in currencies of the home countries.

These indices not only offer a non-U.S. dollar exposure to natural resources, but also assist with the financialization of alternative commodities markets, some of which are completely new, and others that are alternatives to more-established futures markets. Exhibit 2 illustrates the 2021 YTD performance of many of these commodities.

There are good reasons for the recent excitement around these commodities. Several of these commodities are used in renewable diesel applications. Fiona Boal, Head of Commodities and Real Assets at S&P DJI, wrote a twopart blog series discussing the expanding interest in these non-fossil-fuel inputs to renewable energy. Several other of these indices expand the geographic footprint and offer alternatives to the more well-known commodities like gold, corn, and natural gas that are traded on U.S. exchanges. The Tokyo-, London-, Saskatchewan-, Paris-, and Kuala Lumpur-based futures offer commodity participants exposure outside of traditional U.S.-based markets.

Tactically allocating to individual commodities when conditions are ripe has historically only been within the realm of a small group of domain expert traders. But as the broad cohort of market participants becomes more sophisticated and access to alternative asset classes improves, it is possible that the tactical allocation to commodities will expand. Commodities can be used as building blocks to express thematic macro plays and can easily be traded due to highly liquid and robust markets. Commodities also benefit from being equally tradeable, in both long and short positions. Single-commodity indices tracking front-month futures contacts provide the opportunity to access this market on the long or short side.

Check out our new website celebrating 30 years of the S&P GSCI and our newly published thought leadership paper looking at what the next 30 years might have in store for commodities.

The posts on this blog are opinions, not advice. Please read our Disclaimers.