Get Indexology® Blog updates via email.

In This List

Risk-Adjusted SPIVA Year-End 2020 Scorecard: No Evidence to Support Superior Risk Management Skills of Active Managers

Special Purpose Acquisition Companies (SPACs) – Part II

Elevated Volatility Levels in Sectors Remain

Highlights of the SPIVA Canada Year-End 2020 Scorecard

SPIVA and Style

Risk-Adjusted SPIVA Year-End 2020 Scorecard: No Evidence to Support Superior Risk Management Skills of Active Managers

Contributor Image
Berlinda Liu

Former Director, Multi-Asset Indices

S&P Dow Jones Indices

Modern Portfolio Theory tells us that higher returns tend to be associated with higher risk. Active managers tend to boast about their risk management skills and claim that they can generate higher returns than passive funds on a risk-adjusted basis. The Risk-Adjusted SPIVA® Scorecard assesses the risk-adjusted returns of actively managed funds against their benchmarks on both a net-of-fees and gross-of-fees basis. Volatility, calculated as the standard deviation of monthly returns, is used as a measure of risk, and performance is evaluated by comparing return/volatility ratios.

The Risk-Adjusted SPIVA Year-End 2020 Scorecard shows that the significant level of volatility and positive returns of the broad U.S. equity market in 2020 did little to help the case for active managers’ performance. After adjusting for risk, most actively managed domestic funds across market-cap segments underperformed their benchmarks on a net-of-fees basis over mid- and long-term investment horizons. Even on a gross-of-fees basis, the number of outperforming segments declined over time; small-cap value and real estate funds were the only two categories that outperformed their benchmarks over the 20-year period.

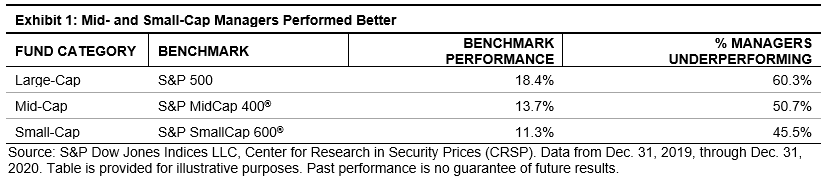
For comparison, in Exhibit 2, we listed the performance statistics of active equity funds relative to their benchmarks, both on an absolute return basis (as presented in the SPIVA U.S. Year-End 2020 Scorecard) and on a risk-adjusted basis. Over the 20-year period, fewer than 15% of actively managed funds were able to outperform across any of the three categories, whether the returns were adjusted for risk or not.

Exhibit 3 further confirms that, even within each capitalization segment, little evidence was found to support the theory that higher returns are associated with higher risk. Plotting the annualized returns and annualized volatility of individual funds in scatter plots, we found weak correlations and no trend between these two variables, indicating the difficulty to generalize active managers’ risk management skills as a group. The yellow dots in Exhibit 3 represent the annualized return and volatility of the three benchmarks. Clearly, the benchmark produced higher returns than most active funds at the same level of volatility.

Conclusion

Although active managers claim that their risk management skills are superior to passive investment strategies, their claim does not stand the test of historical statistics. The Risk-Adjusted SPIVA Year-End 2020 Scorecard shows that our SPIVA Scorecard results also hold on risk-adjusted basis. Most active funds lagged their benchmarks in the long term, and we found little evidence to support the assumption that higher risks were rewarded by higher returns.

The posts on this blog are opinions, not advice. Please read our Disclaimers.

Special Purpose Acquisition Companies (SPACs) – Part II

Contributor Image
Jason Ye

Director, Factors and Thematics Indices

S&P Dow Jones Indices

In the previous blog, we introduced SPACs and discussed market trends that emerged given SPACs’ popularity. In this blog, we will discuss SPACs’ lifecycle, as well as the benefits and risks of investing in SPACs.

SPAC Life Cycle

There are three stages in a typical SPAC life cycle.

1. A SPAC’s IPO

When SPAC sponsors form a SPAC, they are typically given 20% of the post-IPO shares for a nominal investment amount. The SPAC then goes through the IPO process. In a typical SPAC structure, the SPAC raises capital by issuing units consisting of one share and one-half or one-third of a warrant. On NASDAQ for example, the shares are generally priced at USD 10 and the warrants are typically struck 15% out of the money (USD 11.50) with a five-year term and a USD 18 forced exercise.1

The capital raised is held in a trust account. The common stock and the warrant typically begin to trade separately, starting on the 52nd day following the IPO.2 Thus, a SPAC could have multiple instruments listed simultaneously, including unit, common stock, and warrant.

2. Seeking a Target

After the IPO, the sponsors will start to search for an acquisition target and finalize the transaction terms once the target is found. NASDAQ requires that the transaction must be valued at 80% or more of the funds held in the trust.3 Typically, the sponsors have 18-24 months to find a target.4

3. De-SPAC

Once the acquisition target is found, depending on the SPAC’s prospectus, shareholders may need to vote on the transaction, or they will receive redemption notices if they choose to receive a pro-rata amount from the trust account and walk away. If the acquisition is approved by shareholders, the SPAC merges with the target company and will often undergo an identifier change to reflect the name of the target business. Otherwise, the sponsor will resume searching for another target. If the sponsor fails to find a suitable target within the pre-defined timeframe, the SPAC will be liquidated, and the investors will receive their capital back from the trust account. This process is detailed in Exhibit 1.

Based on a SPAC’s life cycle, we can split a SPAC’s status into five categories: active, announced merger, effected merger, cancelled merger, and liquidated. Currently, most SPACs in the U.S. are actively looking for the acquisition target (see Exhibit 2).

Benefits and Risks of SPAC Investing

Market participants can gain several benefits through investing in a SPAC, compared with investing in private equity.

  1. Institutional access: SPACs offer access to investment in acquisitions that are typically otherwise restricted to large institutions through private equity. With SPACs, retail investors can invest with the SPAC sponsors who usually have investment and industry expertise. Unlike private equity, investors do not have to pay management fees to SPAC sponsors.
  2. Downside protection: The capital raised through an IPO is held in a trust account pending approval of the acquisition, and a redemption option is available for investors. The trust account provides a minimum liquidation value per share, which serves as downside risk protection.

However, investors should also be aware of the risks involved when investing in SPACs.

  1. It’s a blank check company: A SPAC possesses no assets other than the sponsors’ professed “know-how.” The investor is betting on the sponsors to make a wise acquisition. Presumably, an investor would not invest in a SPAC without confidence in SPAC sponsors and their prior track record of investment success.
  2. Incentive misalignment – time pressure: The 24-month timeline imposed on the sponsors to acquire a target puts SPAC sponsors under significant pressure. Unlike investors, SPAC sponsors are not entitled to receive any interest back if the acquisition does not occur. This structure creates an almost “do-or-die” situation for sponsors. Thus, SPAC sponsors have every incentive to acquire a target within the requisite period.
  3. Incentive misalignment – valuation: Since the target company must comprise over 80% of the trust account asset, the SPAC’s sponsors may overpay for the target company to get the deal done.

Summary

A typical SPAC goes through three stages during its life cycle: IPO, seeking a target and business combination (de-SPAC). When investing in SPACs, investors gain access to private equity-like opportunities with downside protection. However, investors should also be aware that SPACs possess no assets, and sponsors’ interests may not align with those of the investors. In the next blog, we will analyze SPACs’ liquidity and historical performance.


Reference:
Lewellen, S. (2009). SPACs as an Asset Class. Available at SSRN 1284999 http://ssrn.com/abstract=1284999

1 The specific terms of listing price and warrant depend on the individual IPO prospectus.

2 https://www.nasdaq.com/articles/your-guide-to-analyzing-spac-investments-2021-01-31/

3 https://www.sec.gov/rules/sro/nasdaq/2020/34-90245.pdf.

4 NASDAQ allows 36 months for SPACs to complete business combination; SPACs are also allowed to extend this deadline per shareholders’ approval.

The posts on this blog are opinions, not advice. Please read our Disclaimers.

Elevated Volatility Levels in Sectors Remain

Contributor Image
Fei Mei Chan

Former Director, Core Product Management

S&P Dow Jones Indices

The shock that the onset of the pandemic sent through the financial markets a year ago is mostly a distant memory. The S&P/TSX Composite Low Volatility Index was up 34% for the one-year period ending March 19, 2021, lagging its benchmark index. This is not surprising given that the performance of the S&P/TSX Composite Index has been spectacular, up 60% over the past year (from the lows of the pandemic-related panic last March). Volatility at the sector level, though, remains elevated.

The S&P/TSX Composite Low Volatility Index rebalanced following the close of trading on March 19, 2021, and the changes were minor. But the results of this rebalance point to more idiosyncratic dynamics that may be happening at the stock level. Despite a 3% increase in volatility for the Materials and Information Technology sectors, the low volatility index increased weight in both sectors, while scaling back on Industrials and Utilities. There were only three name changes of the 50 companies in the index.

The posts on this blog are opinions, not advice. Please read our Disclaimers.

Highlights of the SPIVA Canada Year-End 2020 Scorecard

Contributor Image
Berlinda Liu

Former Director, Multi-Asset Indices

S&P Dow Jones Indices

Although 2020 was a year that offered ample opportunities for stock pickers to shine, most Canadian active fund managers in five of the seven categories tracked by the SPIVA® Canada Year-End 2020 Scorecard underperformed their benchmarks over the past year.

The Canadian equity market was not spared from the COVID-19 shock in 2020. Nevertheless, major local equity benchmarks finished positive, with the exception of the S&P/TSX Canadian Dividend Aristocrats® Index. Among actively managed Canadian equity funds, 88% lagged the S&P/TSX Composite Index. Canadian Small-/Mid-Cap Equity funds had a banner year, as just 22% failed to beat the S&P/TSX Completion Index. Canadian Dividend & Income Equity funds took second place among fund categories, with just 44% lagging the S&P/TSX Canadian Dividend Aristocrats Index.

Results were more uniform and bleaker over longer horizons. At least 84% of funds underperformed their benchmarks in all but one category over the past decade.

Equity funds looking outside of Canada performed better than their domestic-focused peers on an absolute return basis, but still generally underperformed the benchmarks. Thanks to a strong rebound in the U.S., equity funds there posted the highest returns over the past year among all categories, with a 13.6% gain on an equal-weighted basis. However, this was still below the 16.3% return of the S&P 500® (CAD), and 69% of the funds still fell short of their benchmark.

Larger funds in Canada tended to outperform their smaller counterparts, as 22 of the 28 results showed higher asset-weighted returns across the seven fund categories and four investment horizons in the report.

The data from the SPIVA Canada Year-End 2020 Scorecard show disappointing performance of active funds relative to their respective benchmarks. Over the past decade, most funds in all categories failed to beat index investing.

The posts on this blog are opinions, not advice. Please read our Disclaimers.

SPIVA and Style

Contributor Image
Craig Lazzara

Former Managing Director, Index Investment Strategy

S&P Dow Jones Indices

Last week S&P Dow Jones Indices released its SPIVA® U.S. Year-End 2020 Scorecard. As has been the case for 17 of the past 20 calendar years, the majority of active large-cap managers underperformed the S&P 500®. Performance was better for mid- and small-cap managers, as Exhibit 1 shows. What caused the advantage for smaller-capitalization strategies?

Style bias supplies part of the answer. We refer to “style bias” as any systematic tendency in an actively-managed portfolio. For example, if a portfolio habitually tilts toward growth stocks, we’d refer to this tilt as a growth bias. (This is different from making tactical allocations between growth and value, depending on a manager’s judgment of their relative attractiveness.) One of the most important style biases concerns the size of companies in an active portfolio relative to its benchmark index.

Simple as it seems, style bias has much to say about active management. Exhibit 2 examines quarterly data on the relative performance of the S&P 500 and the S&P MidCap 400. Of 76 quarters between 2002 and 2020, the S&P 400TM outperformed the S&P 500 in 42. In those quarters, a majority of large-cap managers outperformed the S&P 500 15 times for a 36% hit rate. In contrast, in the 34 quarters when the S&P 500 beat the S&P 400, the frequency with which most large-cap managers outperformed fell to 12% (4/34).

We see an analogous effect among mid-cap managers, as shown in Exhibit 3. When the S&P 400 outperformed the S&P 500, the frequency with which most mid-cap managers outperformed was 24% (10/42). When the S&P 500 dominated, however, the likelihood that a majority of mid-cap managers would outperform was 59% (20/34).

Historically, large-cap managers perform better when mid-cap stocks beat large caps, and mid-cap managers perform better when large caps beat mid-caps. These results suggest that the average large-cap manager has a small-cap tilt relative to his benchmark, while the average mid-cap manager has a larger-cap tilt. These inferences, which are quite reasonable, help explain SPIVA’s 2020 results. Smaller-cap managers could add value by moving up the capitalization scale. No such reprieve was available to large-cap managers last year.

The posts on this blog are opinions, not advice. Please read our Disclaimers.