Get Indexology® Blog updates via email.

In This List

Biden 1, Climate Change 1.5

A European Perspective on the U.S. Mid-Cap Sweet Spot

The Dangers of Extrapolation

Industrial Commodities Benefit from Hopeful COVID-19 Vaccine News

Moonshots: Catching Lightning in a Bottle?

Biden 1, Climate Change 1.5

Contributor Image
Jaspreet Duhra

Managing Director, Global Head of Sustainability Indices

S&P Dow Jones Indices

“Today, the Trump Administration officially left the Paris Climate Agreement. And in exactly 77 days, a Biden Administration will rejoin it.” –Joe Biden, Nov. 4, 2020. 1

In a crowded field for “standout tweets from a U.S. president or president-elect,” for those of us who have dedicated careers to tackling sustainability challenges, this may be the most memorable tweet of them all.

Now, of course, we don’t want to be too premature in our celebrations. There are still several months until the inauguration of President-Elect Joe Biden and there are practical hurdles that need to be cleared. However, initial signs are promising, with the Biden transition team announcing John Kerry as special envoy on the climate crisis, a position that for the first time will include a seat on the National Security Council.2

What is the Paris Agreement and why does it matter so much that the U.S. rejoins? The Paris Agreement “sets out a global framework to avoid dangerous climate change by limiting global warming to well below 2°C and pursuing efforts to limit it to 1.5°C,3” as recommended by the Intergovernmental Panel on Climate Change (IPCC).

The U.S. is the world’s largest economy and is currently the second-largest emitter of greenhouse gases.4 According to Climate Action Tracker, the U.S. pledge for net zero emissions by 2050, along with similar commitments from China, EU, Japan, and South Korea, means a tipping point is being approached that puts the goal of limiting warming to 1.5°C within reach.5

However, this is no reason for complacency. Alignment with the 1.5°C goal is not a commitment just for governments. The achievement of such an ambitious goal arguably requires participation from all stakeholders, including investors. Climate change ranks as the “highest priority ESG issue facing investors,” according to the Principles for Responsible Investment (PRI).6 Investment portfolios and products may be exposed to climate risks as follows:

  • Transitional risks of climate change (e.g., stranded assets, rising carbon prices, etc.); and
  • Physical risks of climate change (e.g., sea level rise, hurricanes, etc.)

But it isn’t just climate change risks that investment product providers should consider; there are also opportunities available to potentially finance the transition to a lower-carbon economy.

What are the practical tools available to investment product providers who want to manage the risks and opportunities and align their investment products with the Paris Agreement?

At S&P DJI, we have created two benchmarks that align with the 1.5°C scenario: the S&P Paris-Aligned Climate Indices and the S&P Climate Transition Indices, together known as the S&P PACTTM Indices (S&P Paris-Aligned & Climate Transition Indices).  The S&P PACT Indices offer an information tool for investment product providers looking to address a number of climate objectives while still staying as close as possible to the underlying benchmark index.

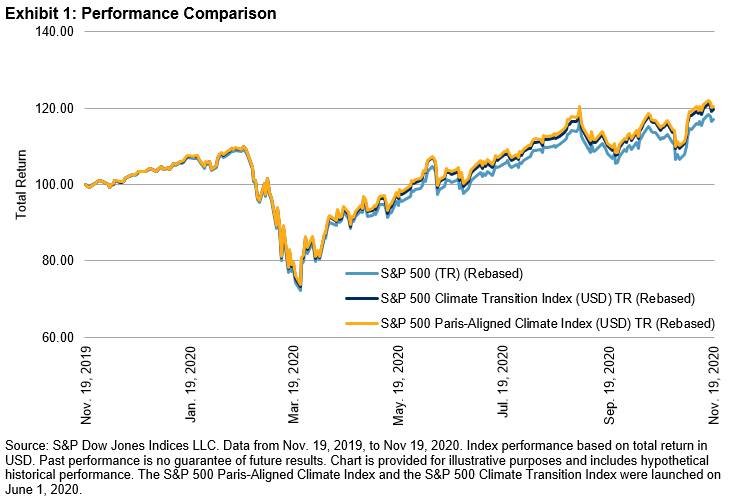
The S&P Paris-Aligned Climate Indices set stricter relative decarbonization objectives of the two benchmarks and include a range of fossil fuel exclusions. The S&P Climate Transition Indices still incorporate significant relative decarbonization objectives but are designed for broader exposure. Crucially, both sets of indices decarbonize at an absolute rate of 7% year-over-year, in line with, or beyond, the decarbonization trajectory from the IPCC’s 1.5°C scenario. From a U.S. equities perspective, the S&P 500® Paris-Aligned Climate Index and the S&P 500 Climate Transition Index both outperformed the broad U.S. benchmark over a period of one year.

There are of course great challenges ahead. President-Elect Biden now has to consensus build and implement strategies to meet ambitious climate targets. We have already seen major investors taking the lead in aligning their investments to the 1.5°C scenario. Benchmarks such as the S&P PACT Indices are designed to make this vital transition much more feasible.

1 https://twitter.com/JoeBiden/status/1324158992877154310

2 https://www.theguardian.com/us-news/2020/nov/23/john-kerry-biden-climate-envoy-appointment

3 https://ec.europa.eu/clima/policies/international/negotiations/paris_en

4 https://www.theguardian.com/us-news/2020/nov/08/joe-biden-paris-climate-goals-0-1c

5 https://climateactiontracker.org/press/bidens-election-could-bring-a-tipping-point-putting-paris-agreement-15-degree-limit-within-striking-distance/

6 https://www.unpri.org/climate-change. The PRI is a UN-supported international network of investors working together to implement its six aspirational principles.

The posts on this blog are opinions, not advice. Please read our Disclaimers.

A European Perspective on the U.S. Mid-Cap Sweet Spot

Should European investors be looking beyond large-cap U.S. equities for core exposure? S&P DJI’s Tim Edwards and State Street Global Advisors’ Rebecca Chesworth explore the case for U.S. mid-caps through broad and tactical sector exposures.


The posts on this blog are opinions, not advice. Please read our Disclaimers.

The Dangers of Extrapolation

Contributor Image
Craig Lazzara

Former Managing Director, Index Investment Strategy

S&P Dow Jones Indices

The contrasts between the first 10 months of 2020 and the month of November were vivid. Consider:

  • At the end of October, the year-to-date total return of the S&P 500® was barely positive (2.77%), but was well ahead of the returns of the S&P MidCap 400® (-6.63%) and the S&P SmallCap 600® (-13.06%). In November, the 500TM performed very well (10.95%), but the 400TM (14.28%) and the 600TM (18.17%) did much better.
  • At the end of October, the cap-weighted S&P 500 had outperformed the average stock in the index (the S&P 500 Equal Weight) by 8.10%. In November, the equal-weight index outperformed by 3.35%.
  • At the end of October, the best-performing sectors were Information Technology (22.13%) and Consumer Discretionary (19.76%), while the forlorn Energy sector had lost more than 50% of its value in 10 months. In November, Energy rose by 28.03%, well ahead of the erstwhile leaders.
  • At the end of October, the best-performing factor indices were Growth (16.89%) and Momentum (15.97%), while value-based factors had all suffered double-digit declines. In November, the S&P 500 Enhanced Value Index rose by 19.82%, handily outperforming the growth and momentum indices.
  • At the end of October, VIX® stood at 38.02, a high level. In November, VIX fell to 20.57, as expectations of future volatility declined.

To summarize, there were market reversals on numerous fronts.

All this may be interesting as a matter of short-term market commentary, but its importance lies in what it illustrates about the fragile persistence of relative winners in equity markets and the risks of extrapolation from the past. These risks help explain two major long-term trends: the consistent underperformance of active managers and the consequent flow of assets to index funds.

Why, we are sometimes asked, do some investors remain loyal to active managers, despite all the evidence to the contrary? One obvious explanation is the natural human tendency to assume that the past predicts the future. In most of life, this isn’t a bad heuristic; the past does predict the future quite often. In some ways our routine daily lives depend on this assumption. Although COVID has kept me away from London for nearly a year, I’m confident that the cars there still drive on the left—because they always have. Investors often make an analogous assumption—they assume that good historical performance predicts good future performance.

And November’s results, in a microcosm, show why this assumption can be dangerous. Almost any extrapolation based on performance through October turned out to be wrong; past performance did not predict future returns. Those who assumed that it would are likely to be disappointed with their results—although perhaps not disappointed enough to forswear active management altogether.

The posts on this blog are opinions, not advice. Please read our Disclaimers.

Industrial Commodities Benefit from Hopeful COVID-19 Vaccine News

Contributor Image
Fiona Boal

Managing Director, Global Head of Equities

S&P Dow Jones Indices

November proved to be a good month for risk assets, including commodities. The headline S&P GSCI rose 12.0%, outperforming the S&P 500®, which gained 10.8%. Promising developments on the COVID-19 vaccine front and the U.S. election outcome rewarded risk assets such as energy and industrial metals, while safe-haven assets like gold lost some luster.

The petroleum complex benefited from the prospect of a revival in demand should COVID-19 vaccines allow travel, transport, and other business activities to resume in the first few months of 2021. The S&P GSCI Petroleum gained 25.1%, though the recovery in prices started from a low and pessimistic base, with the index still down 49.9% YTD. On the last day of the month, OPEC+ postponed talks on oil output levels to Dec. 3, 2020, citing a lack of consensus between members regarding the proposed easing of production cuts starting January 2021.

The S&P GSCI Industrial Metals rose 11.1% in November, with all components contributing positive performance. The S&P GSCI Lead paved the way, up 13.6%, hitting a one-year high. This magnitude is unusual, given it is typically the least volatile of the industrial metals, but reflects an appetite for assets sensitive to economic growth prospects. The S&P GSCI Iron Ore rose 14.6% on the back of strong demand from Asia. The other red metal, S&P GSCI Copper, rose 12.8% to its highest level since May 2013. Positive prospects for renewable energy and electric vehicles, encouraging COVID-19 vaccine news, and China’s factory utilization rates’ rapid expansion provided an impetus for the red metal to move higher.

One casualty of the rush to risk in November was gold; the S&P GSCI Gold fell 5.6% and ended the month near a five-month low. While flows into physically backed ETFs remained positive, the 20.3 metric tons added in October was the smallest monthly increase since December 2019, reflecting a cooling in investor interest in safe-haven assets.

The S&P GSCI Soybeans continued its strong performance for the quarter by rising 10.6% in November. Brazil made a rare purchase of soybeans from the U.S. due to domestic supplies diminishing after making large sales to China. Cocoa and coffee prices both rose by double digits in November. Cocoa prices more than recovered from last month’s slump, with the S&P GSCI Cocoa jumping 18.8% on the back of Hershey sourcing a large volume of beans from the futures market instead of physical sellers. The S&P GSCI Coffee rose 15.2% following fears of adverse weather in Brazil and Central America.

The posts on this blog are opinions, not advice. Please read our Disclaimers.

Moonshots: Catching Lightning in a Bottle?

Contributor Image
Adam Gould

Senior Director, Research and Quantitative Strategist, S&P Kensho Indices

S&P Dow Jones Indices

We introduced the S&P Kensho Moonshots Index (the Moonshots index) and its constituent next-generation innovators in our previous blog. An express intent of the index is to identify innovative companies early in their gestation, when the opportunities for rapid growth may be higher. In this blog, we examine how effective the index is at capturing that potential for higher early-stage growth, and how it stacks up against more established innovators, as reflected in market returns.

To identify established innovators, we constructed a comparative portfolio made up of companies drawn from the selection universe used by the Moonshots index, whose market capitalization exceeded the maximum threshold at each rebalance, but whose Early-Stage Innovation score would have qualified for inclusion (Established Innovators—see the methodology document for more info).

The market consistently rewarded the Moonshots index over the Established Innovators on an annualized return basis over one-, three-, and five-year periods (see Exhibit 1). These findings suggest that the market attaches a premium to the early-stage innovators identified by the Moonshots strategy.

Annualized returns can often mask periods of underperformance; however, Exhibit 2 shows how the Moonshots index consistently outperformed on a calendar year basis, with the only exceptions being 2015 and 2018, when the Established Innovators edged ahead.

It is also worth noting that, despite its focus on relatively smaller companies, the Moonshots index and the Established Innovators exhibited similar levels of volatility. The outperformance of the Moonshots index relative to the Established Innovators is therefore not a function of higher risk.

The magnitude of the Moonshots index’s historical outperformance relative to small- and mid-cap benchmarks on an annualized basis (see Exhibit 3) emphasizes how differentiated the index is from its similarly sized peers. In fact, during a time when small- and mid-cap companies generally underperformed their larger brethren, it is of particular interest that the Moonshots strategy is able to outpace both constituencies.

However, a review of calendar year relative performance (see Exhibit 4) suggests a more nuanced picture.

It highlights an important characteristic: accelerating outperformance as emerging exponential innovation gains traction.

Rapid developments in artificial intelligence, robotics and automation, ubiquitous connectivity (Internet of Things) and exponential processing power—together, the catalysts of the Fourth Industrial Revolution—as well as their application in innovations across the global economy, have greatly accelerated over the past few years. The pivot in the Moonshots index’s track record in 2017 from one of moderate underperformance to consistent and significant outperformance is aligned with the increase in investor awareness of these macro dynamics and an acceleration in the adoption of these underlying transformative technologies.

Today’s rapid pace of technological advancement means companies must commit to innovation in order to survive and thrive. The outperformance of the S&P Kensho Moonshots Index versus both established innovators and similarly sized peers suggests that it is successfully capturing the higher growth potential of these emerging leaders, or next-generation innovators.

The author would like to thank John van Moyland, Managing Director, Global Head of S&P Kensho Indices for his contributions to this blog.

The posts on this blog are opinions, not advice. Please read our Disclaimers.