Get Indexology® Blog updates via email.

In This List

While Fixed Income Yields Remain Low, Theta Gang Generates Income through Covered Calls

What’s Driving Insurance Investments?

Energy Drags Commodities Lower in October

Large and In Charge? Giant Firms atop Market Is Nothing New.

A Supply Drop and Demand Pickup Pushed Soybeans to a Three-Year High

While Fixed Income Yields Remain Low, Theta Gang Generates Income through Covered Calls

Contributor Image
Berlinda Liu

Former Director, Multi-Asset Indices

S&P Dow Jones Indices

In response to the economic ravages of COVID-19, central banks and investors around the world went on a bond buying spree, pushing fixed income yields down and complicating the search for portfolio-generated income. While yields are generally off their March 2020 extremes, by historical standards they remain quite diminished.

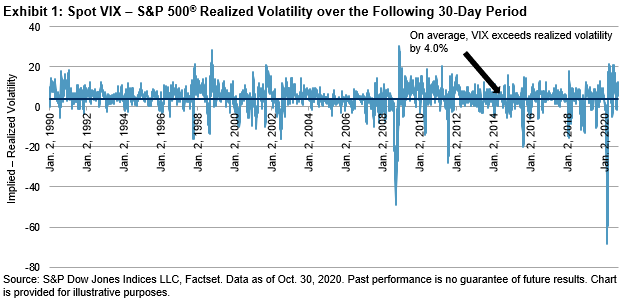
One alternative strategy to generate supplemental income from long-horizon portfolios is to sell covered calls on the holdings of structurally long exposures. This takes advantage of implied volatility in option prices exceeding that of subsequently realized volatility on average.

Alas, typical covered call strategies tend to underperform significantly in strongly upward-trending markets (such as in 2019) or when a sharp downturn is immediately followed by a quick rebound (March-April 2020). In both cases, the options written would be exercised and the holdings called away, costing an investor dearly by not participating in the market’s upside.

The trick, then, is to find a way to generate sufficient income in calm markets to offset any gains given up, and to limit the upside surrendered during rebounds. The S&P 500 18% Daily Risk Control Covered Call 103% Strike Index illustrates one way to accomplish that. While the name is rather unwieldy, let’s look at each of the ingredients it comprises and how they come together:

  • First, start with the S&P 500.
  • Next, add 18% daily risk control. Risk control increases leverage when volatility is low, and decreases leverage when volatility is high, in order to match a given volatility target (variants exist from 5% up to 18%; 18% was chosen here to generally match the historical volatility of the S&P 500).
  • Finally, sell monthly covered calls struck at 103% of the risk controlled index’s level.

So why go through the trouble of adding risk control if only to target the usual volatility of the S&P 500? Because now the covered calls are based on the exposure of the risk-controlled index: exposure that dynamically increases in calm markets and automatically reduces when markets turn volatile.1

When markets begin selling off and increase in volatility, the calls currently being held would have been sold with a strike above the highs, the same as with a normal call writing program. But rather than continuing to sell calls on the full portfolio through the (eventual) nadir, the risk control overlay typically reduces exposure, and thus fewer calls are sold, which means less of the eventual upside is called away. As markets rebound, volatility tends to recede, allowing the risk control index to add exposure—and new calls, at higher strikes, to be written.

This doesn’t completely offset the consequences of selling calls in an upward market, but it does narrow the spread significantly when compared to standard call writing strategies. However, combined with the added exposure of the risk control index in calm periods, it historically not only has generated more premium income than standard call writing strategies, but outperformed the base indices. While bulls and bears endlessly debate market direction and political winds, theta gang can quietly take advantage of higher implied volatility, generating supplemental income and added value over time.

1 The construction of the covered call index uses synthetic call options (priced with a transaction volatility cost of 150 bps) written on the risk control index. In practice, it’s far more likely, and more practical, to dynamically trade options on the S&P 500 itself to match the exposure of the risk control index.

The posts on this blog are opinions, not advice. Please read our Disclaimers.

What’s Driving Insurance Investments?

Explore the headwinds and tailwinds facing insurers and how these factors are impacting general accounts portfolios.

Learn more: https://www.spglobal.com/spdji/en/research/article/etf-transactions-by-us-insurers-in-q2-2020/

The posts on this blog are opinions, not advice. Please read our Disclaimers.

Energy Drags Commodities Lower in October

Contributor Image
Fiona Boal

Managing Director, Global Head of Equities

S&P Dow Jones Indices

The headline S&P GSCI fell 3.6% in October. Energy was responsible for the bulk of the declines in October, while agriculture continued to benefit from the return of demand from China, as well as weather-related supply issues.

Across the energy complex, the rising number of COVID-19 infections, a second wave of lockdowns, and travel restrictions presented a serious threat to oil demand. The S&P GSCI Petroleum fell 10.9% in October, reflecting the risk of a sizeable amount of demand destruction over the coming months. Global oil inventories have remained well above their five-year average, consumption has recovered more slowly than expected, and a resurgent COVID-19 pandemic threatens a double-dip recession. The OPEC+ group is scheduled to hold a policy meeting at the end of November and must decide whether to delay plans to ramp up output by 2 million barrels per day, starting in January 2021, in light of the poor demand picture.

The importance of China’s role in industrial metals was once again on display in October. In contrast to energy, the S&P GSCI Industrial Metals ended the month up 2.8%. According to many market participants, the old era of aluminum, characterized by seemingly immeasurable Chinese smelter capacity expansion, multi-year surpluses, and high inventories, may finally be coming to an end. The S&P GSCI Aluminum ended the month up 5.3%. Nickel also rallied; the S&P GSCI Nickel ended the month 4.3% higher, based on ore shortages and robust demand from China’s stainless-steel mills.

The performance across precious metals was lackluster in October, despite a clear decline in risk appetite among investors resulting from the long-term fiscal and monetary implications of the global pandemic and uncertainty over the outcome of the U.S. presidential election. The S&P GSCI Gold ended the month down marginally but remained up 20.4% YTD.

The S&P GSCI Grains rose 4.3% on the month and its YTD performance turned positive. After a bearish situation surrounding prices over the summer, recent supply issues and a pickup in demand benefitted corn, soybeans, and wheat. Within the softs space, cotton and sugar rose during the month while coffee and cocoa fell. The S&P GSCI Cocoa moved the most, falling 9.9% on the month. A big drop in demand due to the pandemic left the world’s largest cocoa producer, Ivory Coast, struggling to sell 500,000 tons of cocoa beans from its interim harvest.

A recovery in demand from China continued to support hog prices in October; the S&P GSCI Lean Hogs was up 3.9% over the month. However, the cattle market struggled under the weight of heavy supplies, concern regarding demand from the U.S. foodservice sector, and uncertainty surrounding consumers’ food purchasing behavior over the holiday period in light of the pandemic. The S&P GSCI Live Cattle was down 3.6% in October.

The posts on this blog are opinions, not advice. Please read our Disclaimers.

Large and In Charge? Giant Firms atop Market Is Nothing New.

Contributor Image
Wes Crill

Vice President, Research

Dimensional Fund Advisors

While the types of businesses most prominent in the market vary through time, the fact that a small subset of companies’ stocks account for an outsized portion of the stock market is not new. Moreover, research suggests these stocks’ best performance might be in the rearview mirror. The takeaway is that relying on well-established investing principles such as broad diversification helps ensure investors have exposure to a vast array of companies and sectors, potentially providing a more reliable approach to achieving their investment goals.

History Repeats

In 1967, the largest 10 stocks accounted for over 20% of market capitalization, and a marquee technology firm, IBM, was perched at No. 1. This sounds like a description of the current US stock market, dominated by Apple and the other FAANG stocks (Facebook, Amazon, Apple, Netflix, and Google, a subsidiary of Alphabet). Back then, however, IBM represented a larger portion of the market than Apple at the end of 2019 (5.8% vs. 4.1%).

As we see in Exhibit 1, it is not particularly unusual for the market to be concentrated in a handful of stocks. The combined market capitalization weight of the 10 largest stocks, just over 20% at the end of last year, has been higher in the past.

A breakdown of the largest US stocks by decade shows some companies have stayed on top for a long time (see Exhibit 2). AT&T was among the largest two for six straight decades beginning in 1930. General Motors and General Electric ranked in the top 10 at the start of multiple decades. IBM and Exxon were also mainstays in the second half of the 20th century. Hence, concentration of the stock market in a few large companies such as the FAANG stocks in recent years is not a new normal; it is an old normal.

Moreover, while the definition of “high-tech” is constantly evolving, firms dominating the market have often been on the cutting edge of technology. AT&T offered the first mobile telephone service in 1946. General Motors pioneered such innovations as the electric car starter, airbags, and the automatic transmission. General Electric built upon the original Edison light bulb invention, contributing to further breakthroughs in lighting technology, such as the fluorescent bulb, halogen bulb, and the LED. So technological innovation dominating the stock market is not a new normal; it is an old normal too.

Another trend attributed to a new normal is the extraordinary performance of FAANG stocks over the past decade, leading some to wonder if we should expect these stocks to continue such strong performance going forward. Investors should remember that any expectations about the future operational performance of a firm are typically already reflected in its current price. While positive developments for the company that exceed current expectations may lead to further appreciation of its stock price, those unexpected changes are not predictable.

To this point, charting the performance of stocks following the year they joined the list of the 10 largest firms shows decidedly lower performance  results (see Exhibit 3). On average, these stocks outperformed the market by an annualized 0.7% in the subsequent three-year period. Over five- and 10-year periods, these stocks underperformed the market on average.

The only constant is change, and the more things change the more they stay the same. This seems an apt description of the dominant stocks atop the market. For investors, the implications may be that (1) a stock market concentrated in handful of stocks is not necessarily a reason to reevaluate one’s investment approach and (2) the lackluster performance of stocks after they reach the top of the market serves as a reminder of the importance of broad diversification.

DISCLOSURES:
Dimensional Fund Advisors LP is an investment advisor registered with the Securities and Exchange Commission.
Indices are not available for direct investment. Their performance does not reflect the expenses associated with the management of an actual portfolio. Past performance is not a guarantee of future results. Diversification does not eliminate the risk of market loss.
There is no guarantee investment strategies will be successful. Investing involves risks, including possible loss of principal. Investors should talk to their financial advisor prior to making any investment decision.
All expressions of opinion are subject to change. This article is distributed for informational purposes, and it is not to be construed as an offer, solicitation, recommendation, or endorsement of any particular security, products, or services. Investors should talk to their financial advisor prior to making any investment decision.

The posts on this blog are opinions, not advice. Please read our Disclaimers.

A Supply Drop and Demand Pickup Pushed Soybeans to a Three-Year High

Contributor Image
Jim Wiederhold

Former Director, Commodities and Real Assets

S&P Dow Jones Indices

Only a few months ago, it seemed that global soybean supplies were more than ample, and in the case of the U.S., a semi-permanent soybean mountain had been built in the wake of damaged demand from its top customer, China. Fast forward to late October 2020, and the S&P GSCI Soybeans is up 29% since the low in March of this year, making a new high last week driven by abrupt supply cuts and the rapid return of export demand. Earlier this month, the USDA’s monthly World Agricultural Supply and Demand Estimates (WASDE) report forecast a large, and somewhat unexpected, reduction in global soybean stocks. Exhibit 1 illustrates global soybean ending stocks in the 2020-2021 crop year dropping in October 2020 to the lowest level in four years.

Brazil and the U.S. make up approximately 85% of total soybean exports, and there have been supply issues in both countries. There has been limited availability of exportable supplies in Brazil due to COVID-19, and now there is an increased possibility of South American supplies tightening in 2021, particularly if the current La Niña weather pattern leads to drier conditions in Brazil and Argentina. Similarly, in the U.S., dry conditions have negatively affected yields.

On the demand side of the ledger, China imports roughly 60% of total global soybean exports. The recovery of China’s pork industry from the African swine fever has spurred imports in 2020. Soybean meal is used as a source of feedstock in animal production. Chinese monthly imports of soybeans reached a new five-year high this Northern Hemisphere summer (see Exhibit 2).

According to the USDA, outstanding sales to China from the U.S. in mid-September 2020 totaled nearly 17.0 million metric tons, nearly equal to the record set in 2013. Total outstanding sales for all markets in mid-September 2020 were at a record 32.0 million metric tons, a three-fold increase compared with those in 2019. The 2018-2019 crop year coincided with the start of the China-U.S. trade war, which was the catalyst for U.S. soybean exports to plummet. Two years later, China’s commitment has rebounded substantially.

The S&P GSCI Soybeans is designed to provide investors with a reliable and publicly available benchmark for investment performance in the soybean market. S&P Dow Jones Indices offers different versions of this index to cater to the needs of market participants. These versions include enhanced roll yields, dynamic roll yields, covered calls, forwards, 2x leveraged, and currency and regional indices. Single-commodity indices can offer investors an efficient way to access the return streams of unique assets such as soybeans.

The posts on this blog are opinions, not advice. Please read our Disclaimers.