Get Indexology® Blog updates via email.

In This List

Will Powell Power the Aristocrats?

A Stable Regime

Recalled to Life: The S&P SmallCap 600’s Persistent Outperformance after the Russell Reconstitution

Factoring Inflation Into Retirement Planning

S&P 500 and the U.S. Presidential Election

Will Powell Power the Aristocrats?

Contributor Image
Chris Bennett

Former Director, Index Investment Strategy

S&P Dow Jones Indices

As the recovery from the Global Financial Crisis edged forward in the early 2010s, inflation hawks warned about the “certainty” of an imminent spike in inflation following the aggressive stimulus measures taken by global central banks. Unfortunately for the U.S. Federal Reserve and some of its other monetary counterparts, that certainty never materialized, and it then spent the better part of the next decade attempting to stoke what was once thought to be a sure thing.

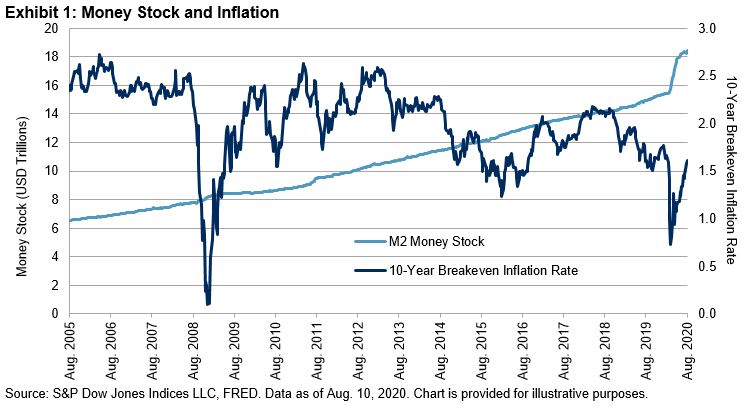
Today, following another crisis and subsequent monetary rescue, the inflation hawks are back, as is uncertainty around the path forward for inflation. Despite massive stimulus and a spike to the money supply earlier this year, the 10-Year Breakeven Inflation Rate is right around where it was to start 2020 (1.72% on Aug. 26, 2020, versus 1.77% on Dec. 31, 2019), 30 bps below the Fed’s previous 2% long-term inflation target.

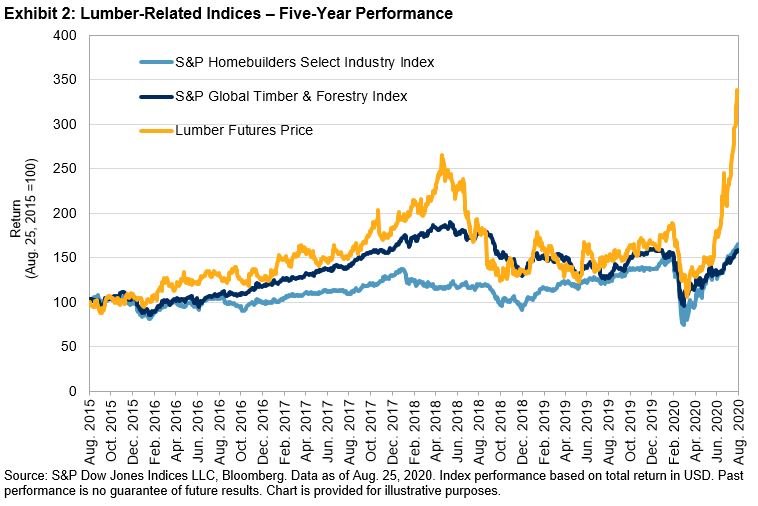
Movement in real asset prices has also sparked inflation fears. The S&P GSCI Gold, for example, was up 25% YTD as of Aug. 26, 2020, though the underlying dynamics likely extend far beyond a potential jump in inflation—gold’s rise also reflects general market fears of economic uncertainty and the sharp decline in bond yields we’ve seen already this year. To pick a commodity somewhat esoteric for the financial markets, but most decidedly “real,” lumber prices have also soared in the past four months, and recently reached record highs on the back of a surge in new home sales.

To help combat the inflationary uncertainty, on Aug. 27, 2020, Fed Chairman Jerome Powell unveiled a new direction for the central bank’s travel: average inflation targeting. This approach would allow the Fed to monitor inflation over longer periods of time and set policy based on where inflation has been on average, rather than where inflation is today. In practice, this means that should inflation rise, the Fed would likely let it run above its 2% annual target for some time before enacting contractionary measures. If the Fed’s policies have the effect of suppressing yields across the fixed income markets even as inflation begins to rise, perhaps investors could be disposed to take a second look at the equity markets for reliable income.

If they do, they might be wise to discern between companies that can maintain a steady stream of cash payouts to shareholders, and those that (perhaps due to a collapse in price) have a high dividend yield. The S&P Dividend Aristocrats® Indices are designed to track the performance of companies with a long history of maintaining or increasing their dividends per share, and that accordingly might be hoped to continue to do so. While those stocks classified as “Aristocrats” are not always those with the highest dividends, the yields on this series of indices can also be quite chunky: the S&P Global Dividend Aristocrats, for example, boasts a 6.2% yield.

Though the future for inflation is uncertain, bond yields could be lower for longer even if inflation picks up. For investors seeking income, perhaps it is time to give the equity markets a second look, and to let the Fed power your entry into the Aristocracy.

The posts on this blog are opinions, not advice. Please read our Disclaimers.

A Stable Regime

Contributor Image
Fei Mei Chan

Former Director, Core Product Management

S&P Dow Jones Indices

In recent days the S&P 500 reached multiple new highs, despite the still-uncertain nature of the economy’s recovery from the COVID-19 pandemic. Year to date through Aug. 20, 2020, the S&P 500 is up 6% while the S&P 500 Low Volatility Index is down 6%.

Market volatility remains high, as evidenced by the charts in Exhibit 1. In all sectors of the S&P 500, volatility spiked in March and, though it has leveled off, remains above average. Similar to three months ago, Energy and Financials were among the sectors with the greatest volatility increase.

It’s not surprising to see that there were only minute shifts in sector allocations for the latest rebalance in the S&P 500 Low Volatility Index (effective after market close Aug. 21). With just 11 names cycling through the index, turnover was well below average. Weights in Energy and Financials continue to be depressed relative to the S&P 500. Notably, since the rebalance in May, Technology has had a higher weighting than Utilities, an occurrence that has only happened once, very briefly, since 1991. It seems the new regime that caused big sector shifts in the previous rebalance is, at the moment, here to stay.

The posts on this blog are opinions, not advice. Please read our Disclaimers.

Recalled to Life: The S&P SmallCap 600’s Persistent Outperformance after the Russell Reconstitution

Contributor Image
Berlinda Liu

Former Director, Multi-Asset Indices

S&P Dow Jones Indices

S&P DJI’s paper, A Tale of Two Benchmarks (first published in in 2009 and later updated in 2015 and 2019), showed that the S&P SmallCap 600® has structurally outperformed the Russell 2000, primarily benefiting from S&P DJI’s index inclusion criteria for profitability, liquidity, and public float. The paper also delves deeper into several secondary attribution analyses, including one of the most well-known market anomalies: the excess returns around the Russell reconstitution, which we’ll explore more deeply here.

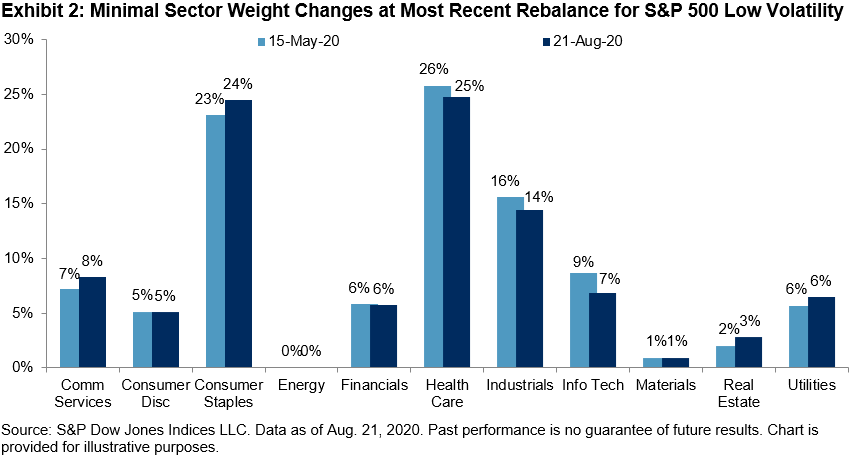
As a brief review, index modifications to the S&P 500®, S&P MidCap 400®, and S&P SmallCap 600 are driven by changes in companies’ size, free float, corporate actions, new IPOs, and meeting inclusion criteria. These are constantly monitored by the Index Committee, and index changes are made throughout the year on an as-needed basis.1

In contrast, the Russell indices originally rebalanced on a quarterly basis, then on a semiannual basis, before moving to the current annual rebalance in 1989. In response to long-standing criticism regarding excessive turnover and significant price volatility on the rebalance day, starting in 2004, Russell published provisional indices, moved the day of the annual rebalance within June, and used NASDAQ’s (then-new) Closing Cross mechanism for determining effective prices.2 Later changes included quarterly IPO additions.

However, these changes failed to address the underlying inefficiency stemming from potential front-running of the rebalance trade that remains a several months-long process. Rather than disentangle the complex pre-inclusion effects, we’ll focus on what happens after the rebalance, as this is of most relevance to passive index portfolios.

Exhibit 2A shows the differences in the average monthly returns of the S&P SmallCap 600 and the Russell 2000. The particularly notable average July outperformance of the S&P SmallCap 600 is 0.64% (t-stat = 2.92), as components entering the Russell 2000 at artificially elevated levels mean-revert. As a result, the S&P SmallCap 600 has outperformed the Russell 2000 in July for 19 of the 27 years observed (70.4%).

This reversion does not happen instantly on one trading day either, as would happen for a momentary closing imbalance. Just as the reconstitution is in reality a several months-long process, the unwind has a long tail. Exhibit 3 illustrates the excess returns measured from the rebalance date to selected intervals afterward. While the dislocations have been less extreme in recent years, especially closer to the reconstitution date, a conspicuous gap persisted and continued to widen even after one month.

While fundamental index construction factors have contributed significantly to the S&P SmallCap 600’s persistent outperformance versus the Russell 2000, the annual reconstitution continues to drive a secondary trading-driven inefficiency every July. Passive index portfolios often show little tracking error to the benchmark in the era of hyper-liquid markets and low commissions, but may still regularly pay these invisible costs to arbitragers based on their choice of index.

1 It is important to note that these indices (and the committee) seek to reflect the U.S. equity market in its entirety, including sector coverage, rather than mechanically select the largest companies in order. For more details, please refer to the S&P U.S. Indices Methodology.

2 Matturri, Alex, “2004 Russell Reconstitution Recap,” Northern Trust, July 2004.

The posts on this blog are opinions, not advice. Please read our Disclaimers.

Factoring Inflation Into Retirement Planning

How might inflation impact retirement income? S&P DJI’s Hamish Preston, DFA’s Grady Smith, and DCIIA Retirement Research Center’s Warren Cormier discuss.

Learn More: https://www.spglobal.com/spdji/en/documents/performance-reports/dashboard-sp-stride.pdf


The posts on this blog are opinions, not advice. Please read our Disclaimers.

S&P 500 and the U.S. Presidential Election

Contributor Image
Hamish Preston

Head of U.S. Equities

S&P Dow Jones Indices

2020 has certainly been an extremely unusual year as economies, companies and individuals have grappled with the impacts of COVID-19.  Although this year’s market movements have arguably been even more difficult to predict than usual, and many active managers were wrong-footed earlier this year, investment outlooks have kept at least one eye on the outcome of one extremely well-telegraphed event – the U.S. Presidential election.  With November’s election less than three months away, what is the S&P 500®’s historical record around U.S. elections?

Exhibit 1 shows that the S&P 500 typically rose during U.S. Presidential election years: the benchmark posted a positive price return in 17 of the last 23 election years, giving it a hit rate of roughly 74% and an average return of 7.05%.  But there was substantial cross-sectional variation in election returns: there was a return spread of over 75% between the S&P 500’s best election year (1928) with its worst (2008).

Before anyone uses Exhibit 1 to make inferences about the potential impact of the 2020 election on the S&P 500, it is important to recognize that the performance of the S&P 500 during election years has typically been similar to its performance during other years.  Exhibit 2 shows that the average (and median) calendar year S&P 500 price return, volatility and risk-adjusted returns have been similar across election and non-election years.  Similar results were also observed during the fourth quarter, albeit with slightly greater differences.

Although it can be difficult to identify a clear impact of U.S. Presidential elections at a market level, there appears to have been considerable impact at a sector level.  Exhibit 3 shows the average range in monthly S&P 500 sector returns – calculated as the best-performing sector minus the worst performing sector – between 1990 and 2019.  The highest average range (15.18%) was observed in November during election years, far above the 10.8% average difference across all months.  Notwithstanding the relatively small sample size, this suggests that election impacts were typically observed when investors priced-in the anticipated impact of the election winner’s policies on different market segments.

One recent example of this dynamic came in the 2016 election. While the S&P 500 rose around 4% in November 2016, a whopping 19.34% separated the best-performing sector (Financials) and the worst-performing (Utilities). Hence, correctly identifying who would win the 2016 Presidential election and the anticipated sector impact offered considerable value in 2016.

As a result, although the S&P 500 has been unperturbed by election outcomes, historically, evidence suggests it may be worthwhile to consider the potential benefits of using sectors to express views.  Indeed, not only can picking sectors offer around half the potential value of stock-picking – Exhibit 5 shows that the average monthly S&P 500 sector dispersion (3.08%) was around half the average S&P 500 stock dispersion (6.77%) – but S&P 500 sectors have offered greater capacity for investors looking to express views.

The posts on this blog are opinions, not advice. Please read our Disclaimers.