In politics, “regime change” denotes the replacement of one governmental structure with another; in economics, we use the same term to indicate a shift in the interactions of various parts of the economic or financial system. Political regime changes are easy to identify (after all, a military coup is hard to miss). Defining when an economic regime change has occurred can be more difficult. One way to do it is to observe the interaction of sector and factor indices.
In the first six months of 2020, there were major changes in sectoral volatility. Exhibit 1, which shows factor tilts relative to the S&P Composite 1500® benchmark, demonstrates the changes in the Real Estate and Utilities sectors, both of which are traditionally defensive. Both of these sectors decreased their exposure to the low volatility factor (from well above average to neutral), and simultaneously experienced an increase in their tilt towards high beta (from well below average to neutral).
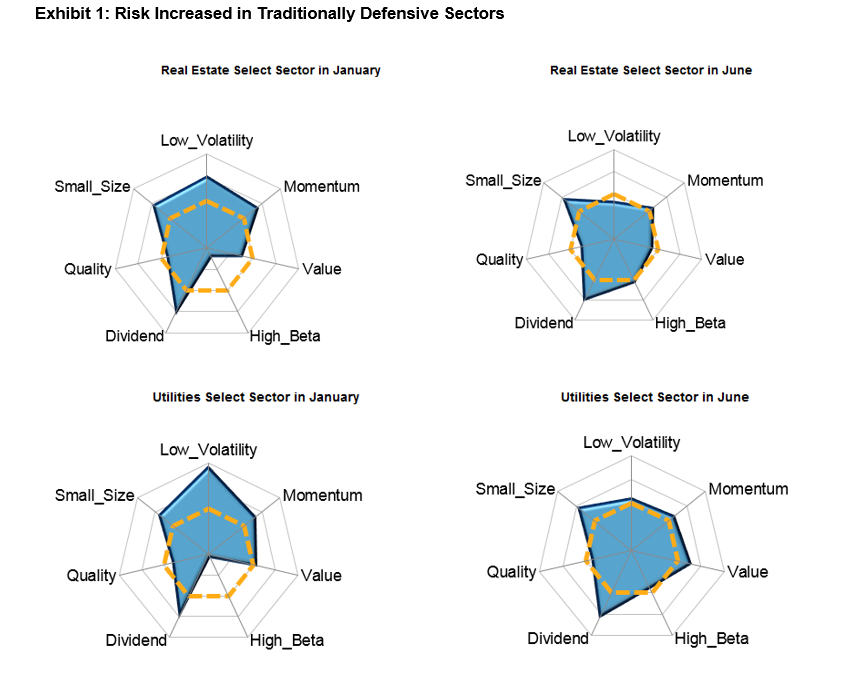 Source: S&P Dow Jones Indices LLC and FactSet. Data as of January and June 2020. Chart is provided for illustrative purposes.
In contrast, Exhibit 2 illustrates that traditionally riskier sectors like Health Care and Technology moved in the opposite direction – increasing their tilt towards low volatility, decreasing their tilt towards high beta, or both.
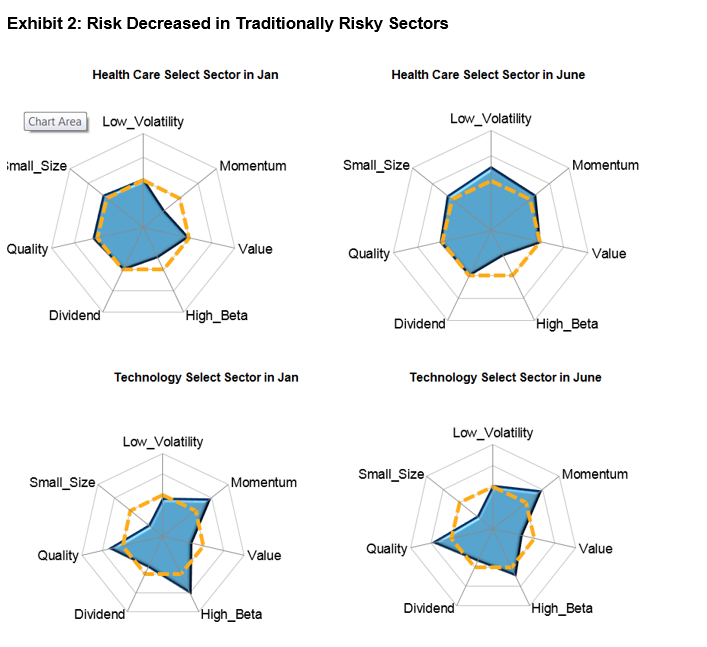 Source: S&P Dow Jones Indices LLC and FactSet. Data as of January and June 2020. Chart is provided for illustrative purposes.
What these exhibits demonstrate is that we have witnessed a major shift in the location of both low volatility and market sensitivity. “Risk off” sectors from a year ago have become riskier; last year’s “risk on” sectors have become, if not defensive, at least much less aggressive.
Sector indices are, in one sense, an ideal vantage point from which to observe market regimes because their turnover is very low. A utility remains a utility, and a technology company a technology company, regardless of the market’s cycles; when we observe changes in a sector index, as in Exhibits 1 and 2, we’re observing changes in a largely constant set of stocks. These exhibits, in other words, tell us that relatively static sets of stocks experienced large changes in factor exposures. We might therefore expect that the relevant factor indices would witness very large changes in sector exposures.
As indeed they did. As a result of the May rebalance, the S&P 500 Low Volatility Index decreased its weight in Real Estate and Utilities and increased its weight towards Consumer Staples and Health Care. The S&P 500 High Beta Index reduced its weight in Information Technology and increased its weight towards Financials. These sector shifts led to record turnover for these indices of 65% and 56%, respectively.
The size of these shifts isn’t surprising. Factor indices, after all, embody their factors “perfectly” only when they’re rebalanced; after that, the factor index and the factor itself can drift apart. Other things equal, drift will be higher when the market’s dispersion is high, as it was earlier this year; the higher the drift, the larger the subsequent rebalance must be.
Sectors and factors are different ways of viewing the world, but they are not mutually exclusive. Seeing both perspectives helps us to understand market regime changes as they occur.
The posts on this blog are opinions, not advice. Please read our Disclaimers.