Get Indexology® Blog updates via email.

In This List

Demystifying the June 2020 Annual Dividend Rebalance

Indices Made Remarkable Recovery in Q2

Commodity Indices in Unprecedented Times

The S&P Quality Developed Ex-U.S. LargeMidCap Index: Attributes and Characteristics

Core and Satellite – The Best of Both Worlds

Demystifying the June 2020 Annual Dividend Rebalance

Contributor Image
Ari Rajendra

Senior Director, Head of Thematic Indices

S&P Dow Jones Indices

During the months of March to May this year, dividend concerns came to the fore as many companies, globally, announced cuts, cancellations, and postponements to their respective dividend programs. We examined the impact of these public announcements on the S&P DJI Dividend Indices, and our assessment then revealed that the extent to which indices were affected varied regionally. Companies within U.S. indices, for example, saw limited negative dividend action, while in Europe, it was a rather different picture.

Results from the June 2020 Annual Review

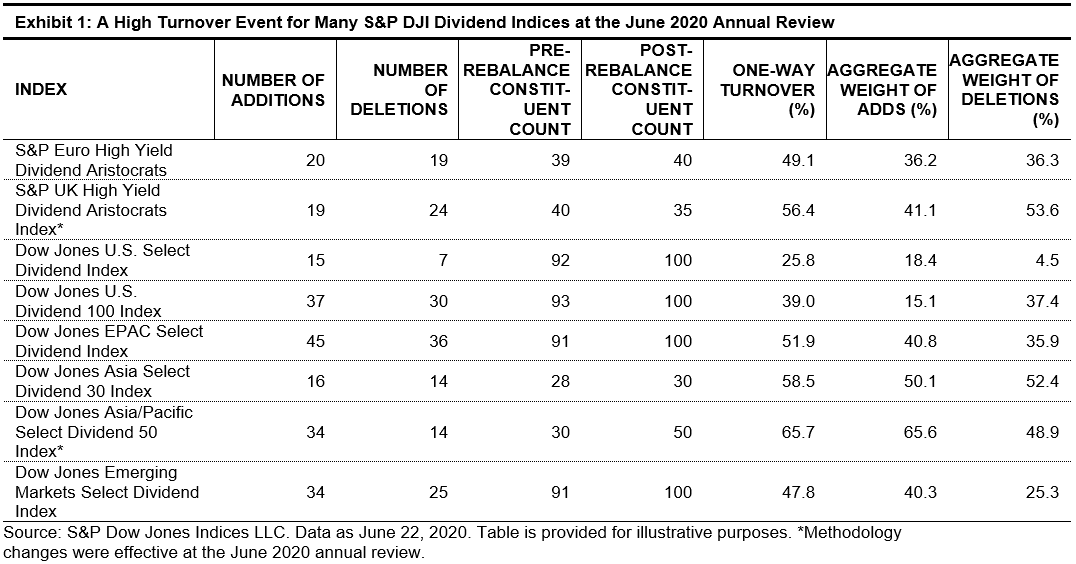
A number of indices, including the S&P Euro High Yield Dividend Aristocrats® (S&P Euro HYDA), S&P UK High Yield Dividend Aristocrats Index (S&P UK HYDA), and Dow Jones Select Dividend Indices,1 underwent annual reviews in June (effective as of the June 22, 2020, open). The rebalance produced significant changes (see Exhibit 1), which we highlight in this blog. Unsurprisingly, it was a high turnover event that led to meaningful sectors shifts for many of the indices. Additionally, a couple of indices also had methodology changes, resulting in a revised target number of constituents in those indices.

A Major Turnover Event by Historical Standards

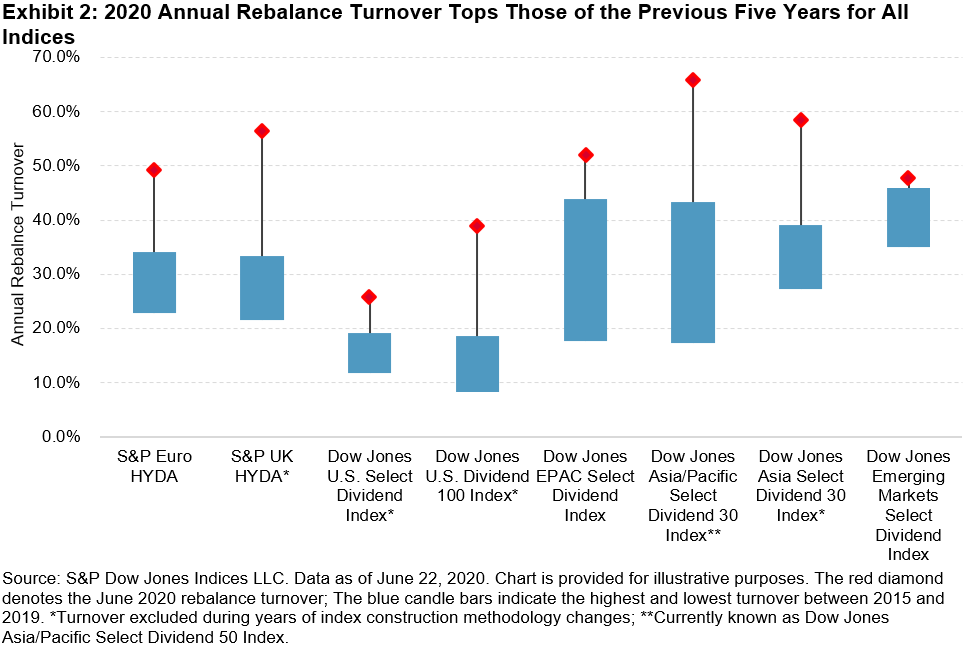
Almost all the dividend indices experienced one-way turnover of 35% or higher, with the exception of the Dow Jones U.S. Select Dividend Index. The turnover figures were considerably higher with historical context, as shown in Exhibit 2, where we investigated annual rebalances going back to 2015.2 Interestingly, however, the turnovers for the S&P Euro HYDA and S&P UK HYDA were lower compared with those of the Global Financial Crisis period (2008/2009, c.70%).

S&P UK HYDA and Dow Jones Asia/Pacific Select Dividend 50 Index Rule Changes

The UK HYDA and Dow Jones Asia/Pacific Select Dividend 50 Index, which were among the top three in turnover, instituted changes to their respective index construction methodologies, effective at this latest review. Brief highlights of the changes are as follows:3

  • The S&P UK HYDA—Previous index rules targeted 40 stocks based on a rank of companies that had increased or maintained dividends for seven consecutive years. This was relaxed down to four consecutive years to ensure that a target of 40 stocks was met. Under the new rules, the constituent count may vary between 30 and 40, subject to the same dividend payment constraints as per previous rules. However, should the eligible number of stocks dip below 30, the number of consecutive years of dividend payments would be relaxed further to three years.
  • The Dow Jones Asia/Pacific Select Dividend 50 Index (DJ APAC Select Div 50)—This index was previously called the Dow Jones Asia/Pacific Select Dividend 30 Index. As the name change suggests, the target number of constituents was increased from 30 to 50.

The significant increase in number of constituents for the DJ APAC Select Div 50 was the likely driver of high turnover at the June 2020 review. However, this was unlikely to be the case for the S&P UK HYDA, for which the scale of dividend cuts and cancellations within the index was the likely contributor.

Dividend Strategies Rotated Out of Consumer Discretionary

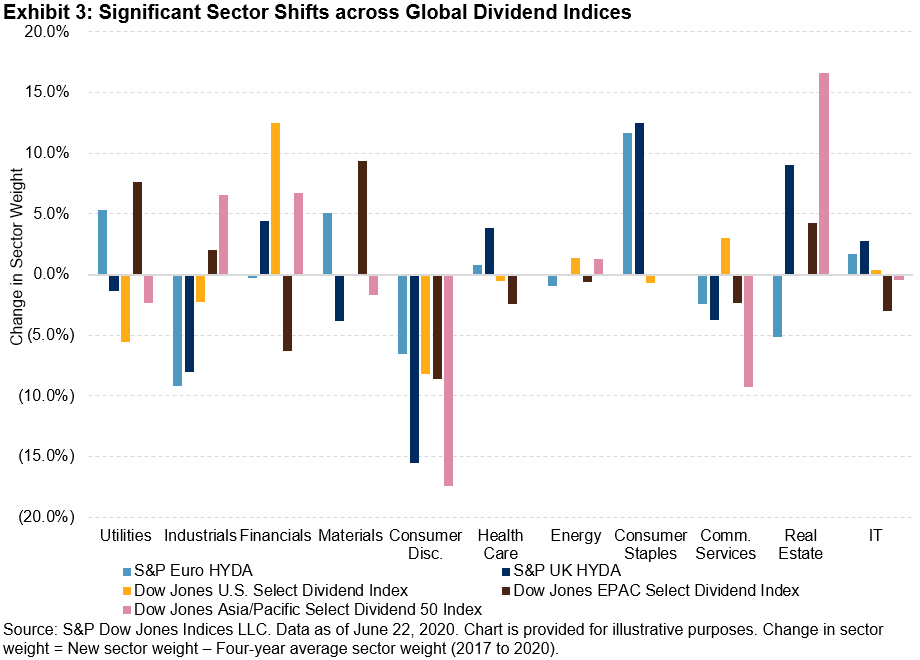
The high turnover of the rebalance was accompanied by significant sector shifts, as shown in Exhibit 3. The rotation comes after four-plus years (since 20174) of relatively stable sector weights for many of the indices. While a material down-weight in Consumer Discretionary was a common theme, the beneficiaries were varied across the indices analyzed. Consumer Staples, for example, saw a considerable weight increase in the S&P Euro HYDA and S&P UK HYDA and Financials was the winner in the Dow Jones U.S. Select Dividend Index. Notably, of the eight indices listed in Exhibit 1, Financials is now the largest weight in six of them, rising from two, pre-rebalance.

1Postponed from its regular annual rebalance schedule in March every year.

2Index turnover was analyzed from 2015 onward, as many indices had been subject to methodology changes prior to 2014.

3For a methodology overview of the S&P Dividend Aristocrats and Dow Jones Select Dividend Indices, please refer to S&P DJI’s Dividend Indices: The Importance of Incorporating Quality Screens.

4The GICS® Real Estate sector was introduced in 2017.

The posts on this blog are opinions, not advice. Please read our Disclaimers.

Indices Made Remarkable Recovery in Q2

Contributor Image
Hamish Preston

Head of U.S. Equities

S&P Dow Jones Indices

After a volatile start to 2020, many investors were looking at double digit declines and were probably re-evaluating their 2020 expected returns. But while COVID-19 continued to determine market sentiment, Q2 hosted a remarkable recovery.  The S&P 500 (+20.54%) and the S&P MidCap 400 (+24.07%) posted their highest quarterly total returns since 1998, while the S&P SmallCap 600 (+21.94%) recorded its largest ever quarterly gain.

More broadly, the overwhelming majority of sector and style indices across the market capitalization spectrum also recovered in Q2: 14 posted their best quarterly total return ever as stimulus packages and tentative indications of a reopening U.S. economy offered tailwinds.  Energy led the way, helped by gains in commodity markets, followed by Consumer Discretionary and Information Technology.

Although a move from spring to summer usually causes a shift in style – at least on the clothing front – there was little change from an investment perspective: growth continued to outperform value, as it has done for most of the last decade.  However, the magnitude of growth’s outperformance during the first half of 2020 was unprecedented: we saw the highest spread in growth and value YTD total returns compared to the first six months of any other year since 1998. Declining U.S. Treasury yields, and the impact on valuations of growth-oriented companies likely helped.

The strong gains observed in Q2 and a mostly positive start to this month have brought certain indices to within striking distance of their 2020 highs: the S&P 500 Information Technology sector needs another 1% in gains, while the Tech-heavy S&P 500 Growth (0.9%) needs slightly less. In contrast, large gains are still needed in the Energy sectors to recover recent highs: the asymmetric impact of drawdowns meant Q2’s gains were not enough to overcome the precipitous declines from the first quarter.

So where does that leave us? Timing the market is challenging and has arguably been made harder by how unusual 2020 has been so far.  While it’s anyone’s guess what might happen during the rest of the year, the first half of 2020 suggests it may be memorable and interesting to watch.

The posts on this blog are opinions, not advice. Please read our Disclaimers.

Commodity Indices in Unprecedented Times

Contributor Image
Fiona Boal

Managing Director, Global Head of Equities

S&P Dow Jones Indices

This blog reflects on the actions taken by S&P Dow Jones Indices (S&P DJI) to ensure that our commodity indices remain replicable and investable in light of the recent extraordinary market conditions experienced in the oil market.

Perhaps no other investable asset has been as severely affected by the COVID-19 pandemic as oil—not equities, not bonds, not currencies, and not even other commodities. While other asset classes have felt the pain of the once-in-a-lifetime decline in global economic activity, their prices have been held up in part by unprecedented levels of fiscal and monetary support. In contrast, we witnessed a dramatic collapse of prices in the oil market during March and April 2020, reminding investors once again that commodities are not anticipatory assets; they reflect current, real-world, “spot supply and demand” conditions.

Extreme volatility and a brief period of negative prices in the WTI crude oil market over recent months have highlighted that modern-day benchmarks are more than market barometers. As the asset management industry evolves and the demand for index-linked passive investment products grows across asset classes, indices also take on the role of rules-based, systematic, and transparent strategies.

As such, index providers must ensure that index methodologies continue to meet their stated objectives. Indices must reflect and adapt to market conditions, including periods of unprecedented market stress. The role of the S&P DJI Index Committee is to serve an oversight function to protect the integrity and quality of S&P DJI indices.

Exhibit 1 summarizes the actions of the S&P DJI Index Committee in response to the risks of negative commodities futures prices.

Indices should be replicable and investable. Indices play a vital role in reflecting the performance of rules-based, transparent investment strategies and form the backbone of financial products such as mutual funds, exchange-traded products, and over-the-counter swaps.

This blog does not provide any indication of the likely course of action by the S&P DJI Index Committee, with the exception of the confirmed and announced changes.

The posts on this blog are opinions, not advice. Please read our Disclaimers.

The S&P Quality Developed Ex-U.S. LargeMidCap Index: Attributes and Characteristics

Contributor Image
Wenli Bill Hao

Director, Factors and Dividends Indices, Product Management and Development

S&P Dow Jones Indices

The COVID-19 pandemic continues to create uncertainty in the global economy. The uncertain economic recovery and increased global corporate defaults have caused equity investors to turn to high-quality companies. The S&P Quality Developed Ex-U.S. LargeMidCap was designed to meet such needs. In this analysis, we investigate the performance, attributions, and characteristics of the index.

The Outperformance

The S&P Quality Developed Ex-U.S. LargeMidCap has been outperforming its benchmark since its launch in July 2014. Up to June 30, 2020, the index had an annualized return of 5.0% (with an annualized volatility of 12.8%) against an annualized return of 2.4% (with an annualized volatility of 13.8%) from the S&P Developed Ex-U.S. LargeMidCap (the benchmark).

During the turbulent first half of 2020, the benchmark dropped about 10% (with an annualized volatility of 30.4%). In contrast, the S&P Quality Developed Ex-U.S. LargeMidCap outperformed its benchmark by 6.7% (with an annualized volatility of 28.8%; see Exhibit 1).

The S&P Quality Developed Ex-U.S. LargeMidCap selects its constituents based on three quality components:

  • Return on equity to measure profitability,
  • Financial leverage ratio to measure debt level, and
  • Balance sheet accruals ratio to measure earnings quality.[i]

Country Allocation

In Exhibit 2, we investigate the country allocation of the constituents in the S&P Quality Developed Ex-U.S. LargeMidCap and its benchmark. During the period studied, the index overweighted Switzerland (5.78%), Denmark (3.75%), and Australia (3.38%). Conversely, the index underweighted Japan (-8.45%), Canada (-2.58%), and South Korea (-2.39%). Over the six-month period, these large country weight differences contributed positively to the outperformance.

Sector Exposure and Performance Attribution

We next decompose excess returns of the S&P Quality Developed Ex-U.S. LargeMidCap into sector allocation and security selection of index constituents.

From Exhibit 3, we see the index was historically overweight in Health Care (13.92%) and Consumer Discretionary (4.14%). In contrast, it was underweight in Financials (-6.73%), Energy (-3.95%), and Real Estate (-3.04%) relative to its benchmark.

Among the total outperformance of 6.7%, more than half of that came from sector-allocation effects (3.79%) and the rest from constituent selection effect (2.94%). The results showed that the methodology of the S&P Quality Developed Ex-U.S. LargeMidCap added value through sector allocation and better-performing security selection during the period studied.

Carbon Characteristics

Besides its outperformance, the S&P Quality Developed Ex-U.S. LargeMidCap was also more carbon efficient[ii] than its benchmark, a positive feature for climate-conscious investors (see Exhibit 4).

In conclusion, the S&P Quality Developed Ex-U.S. LargeMidCap Index showed its merits over the long term and during this uncertain period. In addition, its carbon-efficient feature aligned with sustainability investing.

[i] The detailed factor definition and index construction are laid out in the S&P Quality Indices Methodology.

[ii] As measured by operational and first-tier supply chain greenhouse gas emissions. For more information, please visit www.spglobal.com/spdji/en/documents/additional-material/spdji-esg-carbon-metrics.pdf.

The posts on this blog are opinions, not advice. Please read our Disclaimers.

Core and Satellite – The Best of Both Worlds

Contributor Image
Koel Ghosh

Former Head of South Asia

S&P Dow Jones Indices

The contentious debate of active versus passive is perpetual. Over the past 15 years, SPIVA® Scorecard results have reflected on the trends of active fund management vis a vis benchmarks, wherein statistics tilt the balance in favor of indexing. This recurring feature of benchmark outperformance is contributing to the adoption and growth of the passive investment space.

India is participating in the global passive growth with assets crossing the USD 25 billion mark. Since 1999, S&P Dow Jones Indices has been contributing to Indian markets by sharing its global index expertise to offer passive solutions and educate investors on the benefits of passive investing. The SPIVA India scorecard made its debut in 2013, and the results bear similarities to global trends. One category that stands out in its potential for passive allocation is the large-cap space, which the benchmark S&P BSE 100 has consistently outperformed (see Exhibit 1).

Asset allocation models are critical to achieving a portfolio’s investment objective. Beyond asset class diversification, a combination of strategies can prove beneficial. This is where the core and satellite strategy assists in effective portfolio construction. A strong core provides stability and can contribute to risk mitigation and, ultimately, reaching the financial objective of the portfolio.

Indexing offers the benefits of diversification, lower costs, transparency, lack of fund manager bias, flexibility, and a variety of investment categories from which to choose. These options vary from standard market beta to factor-, theme-, or strategy-based indices. Region and asset class can further widen the gamut of options. Exhibit 2 is demonstrative of the variance in performance of a standard Indian equity market benchmark versus a fixed income index, a factor-based index such as low volatility, a sectoral index, and a global index such as the S&P 500® over different time periods. Portfolio and investment goals can be directional in their core allocation strategy using various indexing alternatives. An active strategy as a satellite can selectively explore the inefficiencies in the market and scope undervalued market opportunities toward the achievement of the overall portfolio objective.

The core and satellite strategy can be used to derive the best of both worlds by using a diverse selection of indices as the core that provides the benefits of indexing, complemented by an active strategy as the satellite, thereby using a combination of a strategic and tactical allocation approaches to portfolio construction.

The posts on this blog are opinions, not advice. Please read our Disclaimers.