Get Indexology® Blog updates via email.

In This List

June Heatwave for Metal and Petroleum Commodities

Can Top-Performing Funds Stay on Top over Time?

Making Sense of the Active Manager’s Conundrum

S&P/ASX All Technology Index Proved Resilient through the Pandemic: An Update Following the Q2 Rebalance

BBB Bond Downgrades Added USD 88 Billion to the High-Yield Bond Market YTD

June Heatwave for Metal and Petroleum Commodities

Contributor Image
Jim Wiederhold

Former Director, Commodities and Real Assets

S&P Dow Jones Indices

The S&P GSCI rose 5.09% in June and 10.47% for the second quarter of 2020. The recovery in the second quarter did not fully retrace the dramatic downside from the first quarter, as can be seen in the index’s -36.50% YTD return. Continued recovery in petroleum commodities contributed, but bullish sentiment in industrial metals such as copper helped keep the S&P GSCI in positive territory.

V-shaped moves off 2020 lows were not distinctive to just the S&P 500®. The S&P GSCI Brent Crude Oil rose 8.44% in June and 38.18% for Q2 2020. Reopening of economies across the world supported an increase of crude oil demand, as countries in lockdown slowly started to get back to pre-pandemic levels of activity. From a supply perspective, market participants will be closely monitoring the already shaky OPEC+ agreement to cut production with concerns that if it fell apart, there could be a repeat of the Saudi-Russia market share battle witnessed in Q1 2020.

The S&P GSCI Natural Gas tanked 10.13% after a similar severe drop in May, making it the lone energy-related commodity among the S&P GSCI’s 24 constituents with a double-digit percentage loss in June.

The S&P GSCI Industrial Metals rose 7.25% last month and 11.46% for the quarter. The S&P GSCI Copper was the biggest outperformer by far, up 11.91% in June and 21.07% for the second quarter. Higher PMI readings across the world and generally better economic data than the record weakness seen two months ago contributed to the positive sentiment for the building blocks of global industry.

The S&P GSCI Gold made a new high in June and is in striking distance of a new all-time high set back in August 2011. The S&P GSCI Silver experienced some profit taking but was up 29.17% for the second quarter and flat YTD. The gold-to-silver ratio remained above the 20-year average.

With abundant supply, the S&P GSCI Grains fell 0.56% in June. The S&P GSCI Wheat took the biggest hit for the month, down 6.61%. The S&P GSCI Sugar was the lone bright spot among the softs commodities, gaining 8.51% in June. Despite a recovery in prices since the beginning of the pandemic, higher sugar production is expected to weigh heavily on the market over the coming months. The two main products derived from sugarcane in Brazil, the world’s largest producer, are sugar and ethanol. Despite a recovery in oil prices, Brazilian mills continue to produce more sugar because the price of ethanol is low.

The S&P GSCI Livestock fell 7.43% in June. The S&P GSCI Lean Hogs fell 19.15% following ongoing cuts to U.S. slaughter capacity due to COVID-19 outbreaks at numerous plants and news that China would require all exporting countries to certify product free of COVID-19. China is a major export destination for U.S. pork, and in April the country accounted for approximately one-third of all U.S. pork exports.

The posts on this blog are opinions, not advice. Please read our Disclaimers.

Can Top-Performing Funds Stay on Top over Time?

Contributor Image
Berlinda Liu

Former Director, Multi-Asset Indices

S&P Dow Jones Indices

Many market participants attempt to identify future top-performing funds using managers’ track records. This practice implicitly assumes that managers’ successful track records reflect skill and that their superior performance will be repeated in the future. Since genuine skill is likely to persist, one key measure of active management skill is the consistency of a fund’s outperformance against its peers.

The U.S. Persistence Year-End 2019 Scorecard shows that few fund managers have consistently outperformed their peers.

The report tracks the top-quartile domestic equity funds of 2010-2014 and evaluates their relative performance for the 2015-2019 period. Contrary to the intuition that a top-quartile fund is more likely to stay in the leading pack, the report shows that their most likely outcome was liquidation or style change (39% together). Only 36% were able to beat the median performer of the peer group (see Exhibit 1). The same story occurred across all major domestic equity categories (see Exhibit 2); less than half of the 2010-2014 top-quartile funds stayed in the top half of the peer group for 2015-2019, and about one-third of them were merged, liquidated, or had a style change.

The most recent performance also cannot predict the future. For example, only 3.84% of domestic equity funds in the top half of the distribution in 2015 maintained that status annually through 2019, significantly below what random chance would predict.[1]  Similarly, just 0.18% of 2015’s top-quartile domestic equity funds maintained that performance over the next four years, again below random chance.[2]

Nevertheless, the report confirms that the worst-performing funds tend to end up in the merge or liquidation category. Fourth-quartile funds were generally the most likely to merge or liquidate over the subsequent three- and five-year windows, with nearly 38% of the bottom-quartile multi-cap funds of 2010-2014 disappearing by 2019.

Perhaps more surprisingly, style changes did not appear to be correlated with fund performance. Top, middle, and bottom performers within a category all generally had similar chances of style drift over the three- and five-year periods. Multi-cap funds had the highest percentage of style change, with 31% making a change over three years and 40% over five years.

The latest U.S. Persistence Scorecard underscores the general warning that past performance is no guarantee of future results. Like our previous reports, the study did not find evidence supporting performance persistence among active managers. Distilling skills from random success requires more complicated methodology beyond a mere peek at track records.

[1]   The odds of a top-half fund in one year randomly staying in the top half over the next four years are 50% * 50% * 50% * 50% = 6.25%, or 1/16.

[2]   25% * 25% * 25% * 25% = 0.39%, or 1/256.

The posts on this blog are opinions, not advice. Please read our Disclaimers.

Making Sense of the Active Manager’s Conundrum

Why are the market environments most conducive to generating positive absolute returns the least conducive to producing positive relative returns? Explore the active manager’s conundrum with S&P DJI’s Craig Lazzara and Anu Ganti.

Read more here: https://spdji.com/research/article/the-active-manager-s-conundrum

The posts on this blog are opinions, not advice. Please read our Disclaimers.

S&P/ASX All Technology Index Proved Resilient through the Pandemic: An Update Following the Q2 Rebalance

Contributor Image
Michael Orzano

Head of Global Exchanges Product Management

S&P Dow Jones Indices

The Australian technology industry roared back to life following a steep first quarter selloff. After peaking on Feb. 17, 2020, the S&P/ASX All Technology Index plunged 46.8%, bottoming on March 23 at the height of the pandemic-led market selloff. Around this time, however, investors realized that Australia’s technology-oriented companies—many of which are involved in innovative payment processing solutions, software development, and in supporting e-commerce across various industries—were likely to be less affected by—and may even benefit from—the pandemic-related economic and social dislocations.

Between the low on March 23 and June 19, 2020, the index gained a whopping 84.4%, leaving it just 2% off its all-time high and up nearly 10% YTD. Meanwhile, the broad market S&P/ASX 200 remained down about 10% for the year. As illustrated in Exhibit 1, the S&P/ASX All Technology Index outperformed all major sectors of the Australian stock market by a wide margin YTD and over the past 12 months.

Broad-Based Contribution Drove Index Rebound

Drilling down into stock-level performance, we can see that although Afterpay was a clear standout, gaining nearly 560% and accounting for about one-quarter of the index’s total return since the March 2020 low, the overall rebound in index performance was broad based. In fact, all 46 constituent companies posted positive returns between March 23 and June 19, 2020, and about one quarter of the total index return was generated by companies outside of the top 10 contributors.

Addition of Seek Headlines First Post-Launch Index Rebalance

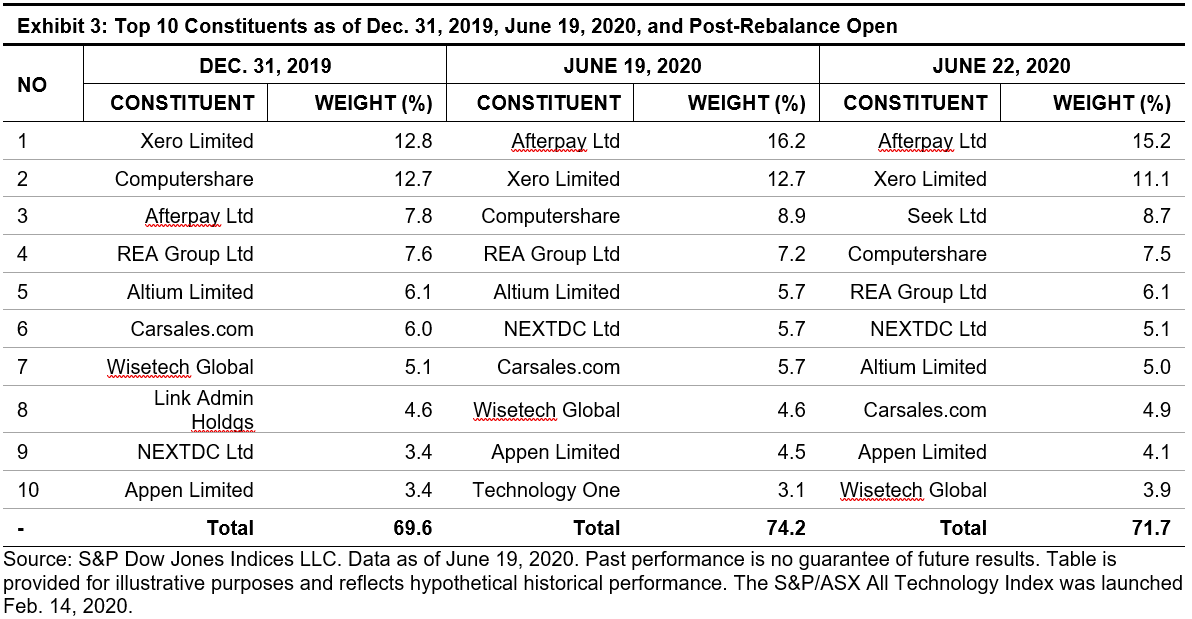
The S&P/ASX All Technology Index underwent its first rebalance since launching in February 2020, and the review resulted in five company additions and one deletion. Best known for its online job matching platforms, Seek was added to the index following its GICS reclassification from Human Resources and Employment Services, which is not eligible for inclusion, to Interactive Media and Services, which is eligible. With a float market cap in excess of AUD 7 billion, Seek entered the index as the third-largest constituent with a weight of 8.7%. Nitro Software and Tyro Payments, both of which went public in December 2019, were also added, as were RPMGlobal Holdings and Temple & Webster Group. Over the Wire Holdings was the only existing constituent dropped from the index.

Exhibit 3 illustrates the index composition changes between the end of 2019, the close of June 19, 2020, prior to the rebalance, and the open of June 22, 2020, which reflects the rebalance changes. Afterpay’s nearly 90% YTD share price gain propelled it to the top position, as its index weight nearly doubled. The rise of NextDC from ninth to sixth place was also notable. Finally, the addition of Seek helped to improve the diversification of the index, reducing concentration among the largest components.

The combination of solid returns, the addition of Seek and new technology IPOs has further increased the depth and breadth of Australia’s technology industry. As of June 22, 2020, the total market cap of the S&P/ASX All Technology Index was nearly AUD 116 billion, up 26% from the end of 2019 and nearly double the AUD 63 billion reached at the end of 2018. The index also reached an all-time high in the number of constituents at 50.

It’s been a wild ride since the launch of the S&P/ASX All Technology Index in February 2020. However, the Australian technology industry has been resilient and clearly demonstrated its role as a unique, high-growth area of the Australian equity market during difficult times.

The posts on this blog are opinions, not advice. Please read our Disclaimers.

BBB Bond Downgrades Added USD 88 Billion to the High-Yield Bond Market YTD

Contributor Image
Hong Xie

Former Senior Director, Global Research & Design

S&P Dow Jones Indices

In recent years, one noticeable development in the corporate bond market has been the rapid growth of the BBB bond market in terms of its absolute amount and relative share of investment-grade corporate bonds. We wrote a blog on this topic in May 2019 detailing the growth of the BBB bond market and its impact on the credit fundamentals of the overall investment-grade bond sector. As of May 2020, BBB corporate bonds grew by 214% to USD 3.6 trillion over the past 10 years, while their share in overall investment-grade bonds increased from 38% to 54%.

Prior to the recent market turmoil due to COVID-19, the rapid increase of BBB bonds had already raised concerns among investors that the high-yield bond market might have difficulty absorbing a wave of potential downgrades with a credit market correction. Some investors have been paying closer attention to the rating outlooks for BBB bonds to monitor their overall credit quality. In this blog, we review the historical composition of BBB bonds with negative credit outlooks and the annual transition of bonds that started the year with BBB ratings but were downgraded to join the high-yield bond index by year-end. The BBB bond and high-yield bond universes are represented by the S&P U.S. Investment Grade Corporate Bond BBB Index and S&P U.S. High Yield Corporate Bond Index, respectively.

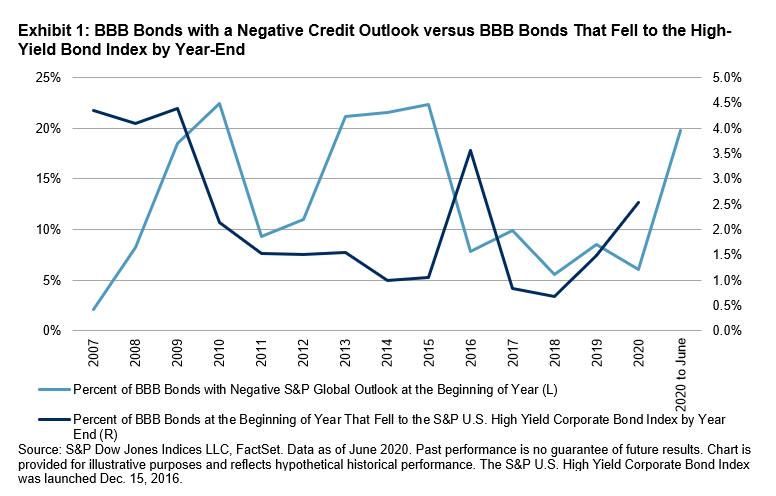
Exhibit 1 compares (1) the share of BBB bonds with a negative S&P Global ratings outlook at the beginning of the year and (2) the share of BBB bonds that were downgraded to join the high-yield bond index by year-end. Historical data since 2007 shows that, as expected, BBB bonds with a negative rating outlook were not always downgraded to a high-yield rating within a year’s time (2010-2015). However, as of June 16, 2020, 2.5% of BBB bonds had been downgraded to high-yield bonds since the beginning of the year, higher than the average of 1.0% over the past three years.

Exhibit 2 shows the annual transition of BBB bonds to the S&P U.S. High Yield Corporate Bond Index from the beginning of the year to the end of the year. The share of BBB bonds that were downgraded to below an investment-grade rating has been on the rise since 2019. As of June 16, 2020, 5.2% of the S&P U.S. High Yield Corporate Bond Index came from the S&P U.S. Investment Grade Corporate Bond BBB Index as of the end of 2019, the highest since 2009 and 2016. These fallen angel bonds from the BBB rating alone have added USD 88 billion of supply to the high-yield bond universe so far this year. Exhibit 2 also shows that as of June 2020, the share of BBB Bonds with negative credit outlook from S&P has gone up to 20% compared to 6% from the beginning of the year.

The credit market has seen a significant widening of spreads during the COVID-19 selloff. With the Fed’s aggressive measures of purchasing corporate bonds and ETFs, credit spreads have retraced 83% and 72% of the recent widening in the investment-grade and high-yield bond markets, respectively, as of June 16, 2020. However, as Fed Chairman Jerome Powell warned this week, a full U.S. economic recovery will not occur until the pandemic has been brought under control, and significant uncertainty remains about the timing and strength of the recovery. A slow economic recovery combined with plunging oil prices should keep pressure on credit quality and rating downgrades. Rating downgrades in BBB bonds particularly could contribute meaningfully to the supply of high-yield bonds and need to be closely monitored.

The posts on this blog are opinions, not advice. Please read our Disclaimers.