Get Indexology® Blog updates via email.

In This List

Indices Made Remarkable Recovery in Q2

Commodity Indices in Unprecedented Times

The S&P Quality Developed Ex-U.S. LargeMidCap Index: Attributes and Characteristics

Core and Satellite – The Best of Both Worlds

Viewing 20 Years of Indexed Core Assets Growth through a SPIVA® Lens

Indices Made Remarkable Recovery in Q2

Contributor Image
Hamish Preston

Head of U.S. Equities

S&P Dow Jones Indices

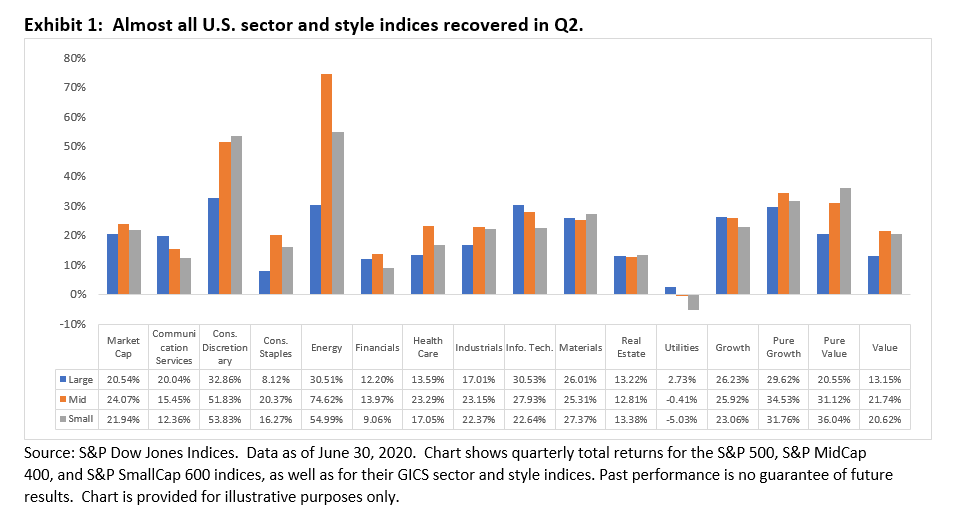
After a volatile start to 2020, many investors were looking at double digit declines and were probably re-evaluating their 2020 expected returns. But while COVID-19 continued to determine market sentiment, Q2 hosted a remarkable recovery.  The S&P 500 (+20.54%) and the S&P MidCap 400 (+24.07%) posted their highest quarterly total returns since 1998, while the S&P SmallCap 600 (+21.94%) recorded its largest ever quarterly gain.

More broadly, the overwhelming majority of sector and style indices across the market capitalization spectrum also recovered in Q2: 14 posted their best quarterly total return ever as stimulus packages and tentative indications of a reopening U.S. economy offered tailwinds.  Energy led the way, helped by gains in commodity markets, followed by Consumer Discretionary and Information Technology.

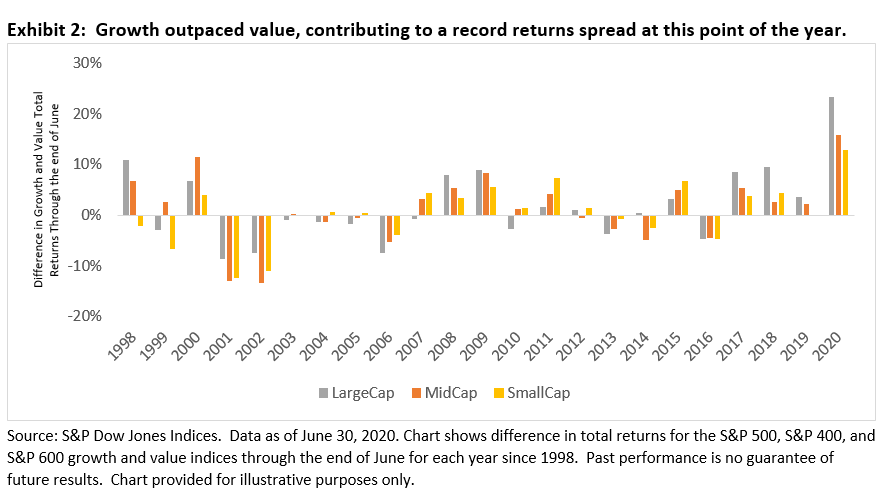
Although a move from spring to summer usually causes a shift in style – at least on the clothing front – there was little change from an investment perspective: growth continued to outperform value, as it has done for most of the last decade.  However, the magnitude of growth’s outperformance during the first half of 2020 was unprecedented: we saw the highest spread in growth and value YTD total returns compared to the first six months of any other year since 1998. Declining U.S. Treasury yields, and the impact on valuations of growth-oriented companies likely helped.

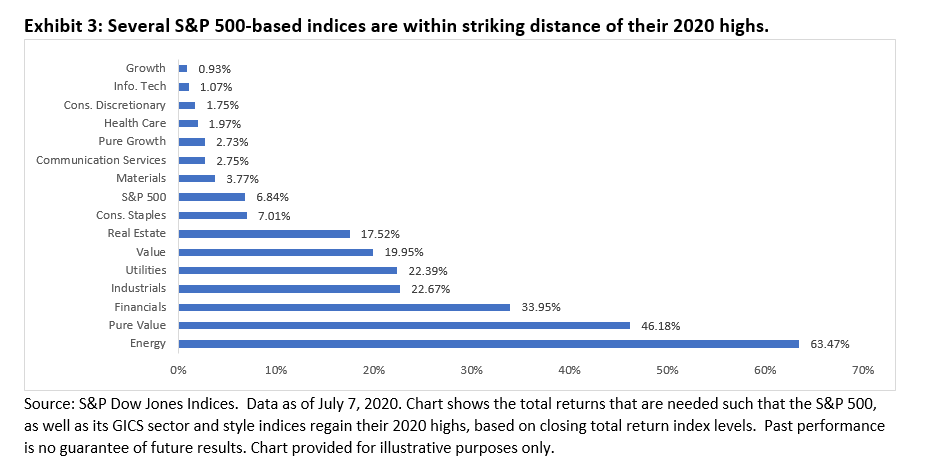
The strong gains observed in Q2 and a mostly positive start to this month have brought certain indices to within striking distance of their 2020 highs: the S&P 500 Information Technology sector needs another 1% in gains, while the Tech-heavy S&P 500 Growth (0.9%) needs slightly less. In contrast, large gains are still needed in the Energy sectors to recover recent highs: the asymmetric impact of drawdowns meant Q2’s gains were not enough to overcome the precipitous declines from the first quarter.

So where does that leave us? Timing the market is challenging and has arguably been made harder by how unusual 2020 has been so far.  While it’s anyone’s guess what might happen during the rest of the year, the first half of 2020 suggests it may be memorable and interesting to watch.

The posts on this blog are opinions, not advice. Please read our Disclaimers.

Commodity Indices in Unprecedented Times

Contributor Image
Fiona Boal

Managing Director, Global Head of Equities

S&P Dow Jones Indices

This blog reflects on the actions taken by S&P Dow Jones Indices (S&P DJI) to ensure that our commodity indices remain replicable and investable in light of the recent extraordinary market conditions experienced in the oil market.

Perhaps no other investable asset has been as severely affected by the COVID-19 pandemic as oil—not equities, not bonds, not currencies, and not even other commodities. While other asset classes have felt the pain of the once-in-a-lifetime decline in global economic activity, their prices have been held up in part by unprecedented levels of fiscal and monetary support. In contrast, we witnessed a dramatic collapse of prices in the oil market during March and April 2020, reminding investors once again that commodities are not anticipatory assets; they reflect current, real-world, “spot supply and demand” conditions.

Extreme volatility and a brief period of negative prices in the WTI crude oil market over recent months have highlighted that modern-day benchmarks are more than market barometers. As the asset management industry evolves and the demand for index-linked passive investment products grows across asset classes, indices also take on the role of rules-based, systematic, and transparent strategies.

As such, index providers must ensure that index methodologies continue to meet their stated objectives. Indices must reflect and adapt to market conditions, including periods of unprecedented market stress. The role of the S&P DJI Index Committee is to serve an oversight function to protect the integrity and quality of S&P DJI indices.

Exhibit 1 summarizes the actions of the S&P DJI Index Committee in response to the risks of negative commodities futures prices.

Indices should be replicable and investable. Indices play a vital role in reflecting the performance of rules-based, transparent investment strategies and form the backbone of financial products such as mutual funds, exchange-traded products, and over-the-counter swaps.

This blog does not provide any indication of the likely course of action by the S&P DJI Index Committee, with the exception of the confirmed and announced changes.

The posts on this blog are opinions, not advice. Please read our Disclaimers.

The S&P Quality Developed Ex-U.S. LargeMidCap Index: Attributes and Characteristics

Contributor Image
Wenli Bill Hao

Director, Factors and Dividends Indices, Product Management and Development

S&P Dow Jones Indices

The COVID-19 pandemic continues to create uncertainty in the global economy. The uncertain economic recovery and increased global corporate defaults have caused equity investors to turn to high-quality companies. The S&P Quality Developed Ex-U.S. LargeMidCap was designed to meet such needs. In this analysis, we investigate the performance, attributions, and characteristics of the index.

The Outperformance

The S&P Quality Developed Ex-U.S. LargeMidCap has been outperforming its benchmark since its launch in July 2014. Up to June 30, 2020, the index had an annualized return of 5.0% (with an annualized volatility of 12.8%) against an annualized return of 2.4% (with an annualized volatility of 13.8%) from the S&P Developed Ex-U.S. LargeMidCap (the benchmark).

During the turbulent first half of 2020, the benchmark dropped about 10% (with an annualized volatility of 30.4%). In contrast, the S&P Quality Developed Ex-U.S. LargeMidCap outperformed its benchmark by 6.7% (with an annualized volatility of 28.8%; see Exhibit 1).

The S&P Quality Developed Ex-U.S. LargeMidCap selects its constituents based on three quality components:

  • Return on equity to measure profitability,
  • Financial leverage ratio to measure debt level, and
  • Balance sheet accruals ratio to measure earnings quality.[i]

Country Allocation

In Exhibit 2, we investigate the country allocation of the constituents in the S&P Quality Developed Ex-U.S. LargeMidCap and its benchmark. During the period studied, the index overweighted Switzerland (5.78%), Denmark (3.75%), and Australia (3.38%). Conversely, the index underweighted Japan (-8.45%), Canada (-2.58%), and South Korea (-2.39%). Over the six-month period, these large country weight differences contributed positively to the outperformance.

Sector Exposure and Performance Attribution

We next decompose excess returns of the S&P Quality Developed Ex-U.S. LargeMidCap into sector allocation and security selection of index constituents.

From Exhibit 3, we see the index was historically overweight in Health Care (13.92%) and Consumer Discretionary (4.14%). In contrast, it was underweight in Financials (-6.73%), Energy (-3.95%), and Real Estate (-3.04%) relative to its benchmark.

Among the total outperformance of 6.7%, more than half of that came from sector-allocation effects (3.79%) and the rest from constituent selection effect (2.94%). The results showed that the methodology of the S&P Quality Developed Ex-U.S. LargeMidCap added value through sector allocation and better-performing security selection during the period studied.

Carbon Characteristics

Besides its outperformance, the S&P Quality Developed Ex-U.S. LargeMidCap was also more carbon efficient[ii] than its benchmark, a positive feature for climate-conscious investors (see Exhibit 4).

In conclusion, the S&P Quality Developed Ex-U.S. LargeMidCap Index showed its merits over the long term and during this uncertain period. In addition, its carbon-efficient feature aligned with sustainability investing.

[i] The detailed factor definition and index construction are laid out in the S&P Quality Indices Methodology.

[ii] As measured by operational and first-tier supply chain greenhouse gas emissions. For more information, please visit www.spglobal.com/spdji/en/documents/additional-material/spdji-esg-carbon-metrics.pdf.

The posts on this blog are opinions, not advice. Please read our Disclaimers.

Core and Satellite – The Best of Both Worlds

Contributor Image
Koel Ghosh

Former Head of South Asia

S&P Dow Jones Indices

The contentious debate of active versus passive is perpetual. Over the past 15 years, SPIVA® Scorecard results have reflected on the trends of active fund management vis a vis benchmarks, wherein statistics tilt the balance in favor of indexing. This recurring feature of benchmark outperformance is contributing to the adoption and growth of the passive investment space.

India is participating in the global passive growth with assets crossing the USD 25 billion mark. Since 1999, S&P Dow Jones Indices has been contributing to Indian markets by sharing its global index expertise to offer passive solutions and educate investors on the benefits of passive investing. The SPIVA India scorecard made its debut in 2013, and the results bear similarities to global trends. One category that stands out in its potential for passive allocation is the large-cap space, which the benchmark S&P BSE 100 has consistently outperformed (see Exhibit 1).

Asset allocation models are critical to achieving a portfolio’s investment objective. Beyond asset class diversification, a combination of strategies can prove beneficial. This is where the core and satellite strategy assists in effective portfolio construction. A strong core provides stability and can contribute to risk mitigation and, ultimately, reaching the financial objective of the portfolio.

Indexing offers the benefits of diversification, lower costs, transparency, lack of fund manager bias, flexibility, and a variety of investment categories from which to choose. These options vary from standard market beta to factor-, theme-, or strategy-based indices. Region and asset class can further widen the gamut of options. Exhibit 2 is demonstrative of the variance in performance of a standard Indian equity market benchmark versus a fixed income index, a factor-based index such as low volatility, a sectoral index, and a global index such as the S&P 500® over different time periods. Portfolio and investment goals can be directional in their core allocation strategy using various indexing alternatives. An active strategy as a satellite can selectively explore the inefficiencies in the market and scope undervalued market opportunities toward the achievement of the overall portfolio objective.

The core and satellite strategy can be used to derive the best of both worlds by using a diverse selection of indices as the core that provides the benefits of indexing, complemented by an active strategy as the satellite, thereby using a combination of a strategic and tactical allocation approaches to portfolio construction.

The posts on this blog are opinions, not advice. Please read our Disclaimers.

Viewing 20 Years of Indexed Core Assets Growth through a SPIVA® Lens

Contributor Image
Berlinda Liu

Former Director, Multi-Asset Indices

S&P Dow Jones Indices

In 1973, Princeton professor Burton Malkiel wrote the book, A Random Walk Down Wall Street, laying out a case against the mutual funds of the time as persistently underperforming market indices. Malkiel recommended[i] that the New York Stock Exchange create a fund that simply bought and held stock in the companies comprising the indices. Somewhat quaintly, he also suggested that the NYSE run the fund on a non-profit basis.[ii]

The 1976 initial offering for the first equity index mutual fund (tracking the S&P 500®) raised USD 11 million. Boosted by the proliferation of defined contribution retirement programs (401[k] plans in the U.S. arose from the Revenue Act of 1978) and turbocharged by ETFs starting in 1993 (again, first tracking the S&P 500), by 2019, USD 4.6 trillion was directly indexed to the S&P 500, with USD 6.4 trillion tracking all S&P DJI indices. S&P DJI estimates the cumulative savings from indexing versus active equity fund fees at USD 320 billion over 1996-2019, just for the S&P DJI benchmark indices.

While S&P DJI’s SPIVA series regularly looks in more depth around the world and by fund style, perhaps now is a good time to review the longer-term trends and continued value behind indexing. Over the past 20 years (May 2000-April 2020), an investor in an active fund had a roughly 90% chance of being outperformed by the corresponding S&P DJI benchmark. If the underperformance wasn’t punishment enough, nearly two-thirds of funds were merged or liquidated in that time, while one-quarter of funds drifted away from their initial style. Furthermore, SPIVA Persistence reports have consistently shown that even the top funds of one measurement period are unlikely to retain their ranking in the next.

However, the story is more than a binary sieve of funds underperforming or surviving. Exhibits 3 and 4 show the superior returns of indices, benefiting from better stock picking (or, more accurately, no stock picking) and not having the fee drag. Reinforcing Einstein’s claim of compound interest as the Eighth Wonder of the World, a “satisfied-with-just-average investor” earned between 0.8% and 2.8% more in annualized terms, resulting in an impressive 42%-184% cumulative benefit over 20 years.

Malkiel’s seminal work helped launched a revolution in investments and personal finance, arguably putting the book in the same league as The Wealth of Nations (Adam Smith, 1776) and Das Kapital (Karl Marx, 1867) for its influence on asset accumulation. Malkiel’s vision of a low-cost fund for the masses has finally come to fruition: capitalism and technology have guillotined costs, with most U.S. brokerages now charging zero commissions and numerous index funds’ annual fees measured in low-single-digit basis points.

[i] Malkiel was neither the first nor the only person with this observation and recommendation, but his book was more widely read than previous academic publications, especially among non-professional investors.

[ii] In fairness, the NYSE was nominally structured as a non-profit exchange until its 2006 IPO.

The posts on this blog are opinions, not advice. Please read our Disclaimers.