Get Indexology® Blog updates via email.

In This List

How is the Current Environment Impacting Your Retirement?

Investing for Ignorance

The S&P BSE 100 ESG Index: A Socially Responsible Investment Strategy

Is Mid-cap Outperformance an Illusion?

The Defensive Advantage

How is the Current Environment Impacting Your Retirement?

Explore how our new quarterly dashboard on S&P STRIDE can help investors better understand and plan for retirement with S&P DJI’s Hamish Preston.

Get the latest dashboard: https://spdji.com/documents/commentary/dashboard-stride-2020-03.pdf.

The posts on this blog are opinions, not advice. Please read our Disclaimers.

Investing for Ignorance

Contributor Image
Zachary First

Executive Director

Drucker Institute, Claremont Graduate University

Ignorance is among the most reliable side effects of a one-in-100-year event. Whether hurricane, market crash, or pandemic, the valuable information most investors cannot know will dwarf what they can know—let alone what they actually do know.

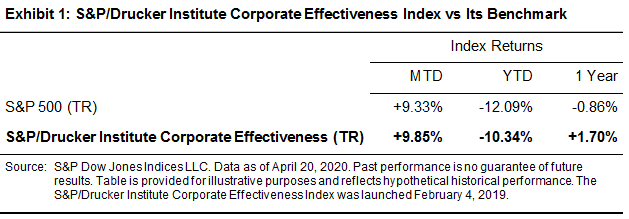
Now, there’s a new source of insight: the S&P/Drucker Institute Corporate Effectiveness Index. And it’s had a strong first full year as a live index since launching in February of 2019.

The index takes a decidedly different approach than its more conventional ESG stablemates. Widely adopted ESG metrics determine less than 20% of a stock’s Corporate Effectiveness score, which drives constituent selection and weighting in the index. Instead, much of a company’s score is based on its management’s so-called “intangibles” that are in fact highly material: customer satisfaction, innovation, and employee engagement. What’s more, the index has achieved its record with a strong adherence to the holistic, humanistic management principles of Peter Drucker, appealing to investors who seek a no-compromise balance of outperformance and values.

The Drucker principles used to construct the index are the same on which many conventional ESG factors are built—and nearly identical to the pillars of the Business Roundtable’s headline-grabbing 2019 statement on the purpose of a corporation (a declaration that S&P Global’s CEO Douglas Peterson himself signed).

Analogous to the human body, where conventional ESG indices focus on the heart, the Corporate Effectiveness index aims to examine the entire corporate anatomy. This holistic approach can result in significant constituent differences from mainstream ESG indices while still achieving exceptional performance vs. the S&P 500.

Clorox and Costco illustrate the Corporate Effectiveness Index’s holistic, values-driven path to outperformance.

Clorox (+25.85% YTD) has the tenth-highest weight in the index (which is weighted by score) while it doesn’t even crack the top 100 in the S&P 500 ESG index (weighted by float-adjusted market cap). While both indices give Clorox a boost for its excellent industry-relative ESG performance (94th percentile), the S&P/Drucker Institute Corporate Effectiveness Index is also bullish on the firm for its 95th-percentile scores in Customer Satisfaction and Employee Engagement and Development.

Costco (+6.98% YTD) is a similar case study. The S&P 500 ESG index excluded the stock entirely because Costco’s ESG score was too low relative to its industry group. But Costco has the 25th-highest weight in the Corporate Effectiveness index thanks to its balanced strengths in Employee Engagement and Development (96th percentile), Customer Satisfaction (86th percentile) and Innovation (83rd percentile). By design and in keeping with Drucker’s principles, the Corporate Effectiveness approach treats these other dimensions as equally important indicators of a company’s ability to align economic success with social contribution.

For now, both Clorox and Costco are benefiting from new economic priorities under a pandemic. And when the uncertainties of this crisis eventually fall away, both firms will emerge with strong customer and employee relationships to help them meet whatever challenges and opportunities come next.

For investors who want an index comprised of companies doing good and doing well, there’s little uncertainty about the value of that.

The posts on this blog are opinions, not advice. Please read our Disclaimers.

The S&P BSE 100 ESG Index: A Socially Responsible Investment Strategy

Contributor Image
Ved Malla

Associate Director, Client Coverage

S&P Dow Jones Indices

In recent years, socially responsible investing has gained importance worldwide. There has been a paradigm shift in investment strategy globally, whereby the number of market participants who have become socially conscious and want to hold investments in companies that acknowledge the relevance of environmental, social, and governance (ESG) factors in doing business has significantly increased. ESG investments have matured globally, and many fund managers are tracking ESG indices like the S&P 500® ESG Index and S&P Europe 350® ESG Index, among others. Passive fund managers use exchange-traded funds or structured products that track an ESG index to make investments for market participants, while active fund managers depend on ESG scores to make active investment bets.

In India, however, ESG investing is a new concept, with market participants in the country only recently starting to look at the importance of ESG factors for investing. ESG investing in India is expected to evolve further and align itself with global market trends. This shift is expected to gain importance in the next few years, with more market participants likely integrating ESG aspects into mainstream investment decisions, with the ultimate goal of long-term value creation.

The S&P BSE 100 ESG Index is designed to measure exposure to securities that meet sustainability investing criteria while maintaining a risk/reward profile similar to that of the S&P BSE 100, its benchmark index.

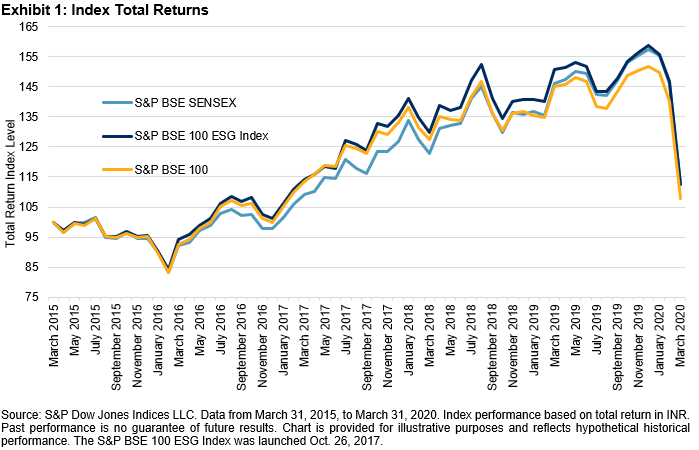
As seen in Exhibit 1, the S&P BSE 100 ESG Index slightly outperformed the S&P BSE 100 and S&P BSE SENSEX over a five-year period.

Exhibit 2 lists the sector breakdown of the S&P BSE 100 ESG Index as of March 31, 2020. Financials had the highest weight at 37.7%, followed by Information Technology and Energy at 16.7% and 13.2%, respectively. Utilities and Industrials had the least weight at 1.7% each.

As of March 31, 2020, the S&P BSE 100 ESG Index had 64 constituents. Exhibit 3 shows the top 10 constituents in the index, which made up nearly 66% of the total index weight. HDFC Bank Ltd and Reliance Industries had the highest weights at 12.63% and 12.17%, respectively.

The posts on this blog are opinions, not advice. Please read our Disclaimers.

Is Mid-cap Outperformance an Illusion?

S&P DJI’s Craig Lazzara explains how style drift could be responsible for inflating the perception of active manager skill.

Read the Performance Trickery blogs at: www.indexologyblog.com

The posts on this blog are opinions, not advice. Please read our Disclaimers.

The Defensive Advantage

Contributor Image
Craig Lazzara

Former Managing Director, Index Investment Strategy

S&P Dow Jones Indices

A wise man told me years ago that there are some things you can’t get if you go after them directly.  If you’ve ever watched someone trying to sound interesting, you’ll realize the truth of my friend’s observation.  There are plenty of interesting people out there, of course, but they achieve that status by pursuing the things that interest them, and their enthusiasm attracts the interest of others.

At least in this respect, portfolio management sometimes imitates life.  Factor indices come in many flavors – some tilt toward popularity and momentum, some toward unloved value names, and so on.  One helpful division is between risk enhancers and risk mitigators.  As the name suggests, risk mitigators have lower volatility levels than the parent indices from which their constituents are drawn.  Familiar examples would include such factor families as low volatility, dividend aristocrats, and quality.

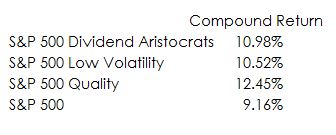
One of the remarkable things about these factors is that, over extended periods of time, they’ve all outperformed the S&P 500:

Source: S&P Dow Jones Indices. Data from Dec. 31, 1994 through March 31, 2020. Chart is provided for illustrative purposes. Past performance is no guarantee of future results.

This is remarkable because none of these factors are designed for outperformance.  The Dividend Aristocrats comprise consistent, committed dividend growers; Low Vol screens for low historical volatility; Quality looks for balance sheet strength and profitability.  All three aim to provide protection in down markets and participation in rising markets; they (usually) outperform when the market falls and underperform when the markets rises.

Yet all three defensive factors have outperformed, at a time when the vast majority of actively-managed portfolios have lagged the S&P 500.  They’ve achieved outperformance without going after it.  One reason for this result is the way in which dispersion interacts with returns.

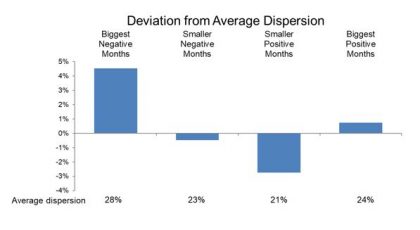
Dispersion measures the degree to which the constituents of an index produce similar results.  If dispersion is low, the impact of deviations from an index – whether by active stock selection or factors tilts – is relatively small.  When dispersion is high, returns are widely separated, and the opportunity for active managers – or factor indices – to add value grows commensurately.  But dispersion varies as the market environment changes:

Source: S&P Dow Jones Indices. Data from from Dec. 31, 1990 through March 31, 2020. Average monthly dispersion in this period was 23.5%. Chart is provided for illustrative purposes. Past performance is no guarantee of future results.

What the chart above illustrates is that when the market declines, dispersion tends to be high.  When the market rises, dispersion tends to be relatively low.  That means that defensive factors tend to outperform when the payoff for outperforming is above average, and to underperform when the penalty for underperformance is below average.  This asymmetric pattern explains why defensive factors typically capture more of the market’s upside and less of its downside – and, serendipitously, why defensive factors generally outperform over long periods of time.

Readers interested in learning more about defensive factors are invited join our webinar on Wednesday April 29th at 2:00 PM EDT.  You can register here.

The posts on this blog are opinions, not advice. Please read our Disclaimers.