Get Indexology® Blog updates via email.

In This List

How S&P DJI’s Fixed Income Indices Harness Data and Technology to Power the Markets of the Future

Volatility and Performance of Options-Related Indexes in the 2010s

Latin America – 2019 in Review

Performance and Volatility for Sectors in the 2010s

S&P and Dow Jones Islamic Benchmarks Finished 2019 with Standout Performance

How S&P DJI’s Fixed Income Indices Harness Data and Technology to Power the Markets of the Future

Contributor Image
Brian Luke

Senior Director, Head of Commodities, Real & Digital Assets

S&P Dow Jones Indices

Thanks to the clever ad campaign by Policygenius, riders of the NYC subway have been reminded that we were promised glass-domed houses, flying cars, and vacation homes in outer space by 2020. Although robot maids may have come true via Amazon’s Alexa, they definitely fall short of the robot maid Rosie from the cartoon The Jetsons. When it comes to technological advances in fixed income, we may be somewhere in between those high expectations and reality. While over-the-counter trading still exists, a large and growing portion of trades are conducted through electronic trading instead of the traditional telephone shouting matches. In the world of fixed income indexing, advances in data processing, index calculations, and analytics have arrived to better meet the needs of investors.

A Big Data Solution for the Bond Market

Every day, S&P Dow Jones Indices calculates millions of data points in the fixed income market that cover hundreds of thousands of bonds. In January 2020, our largest bond index, the S&P Municipal Bond Index, grew to include over 200,000 bonds and has a market value that now exceeds USD 2.5 trillion. With thousands of additional indices and up to 30 years of daily inputs, we require a significant amount of calculation prowess to be able to power the markets of the future.

We built index capabilities with new technology that is better suited to iteratively scan through millions of records and return a set of bonds that qualify for a particular index. Our technology team leveraged MongoDB for our platform, creating more scale and flexibility than previous technology offered. Through its single document storage mechanism, we have achieved greater performance and efficiency to respond to increasing demand.

Inside the S&P Dow Jones Fixed Income Calculation Engine

In addition to index returns, S&P DJI’s fixed income indices provide various risk measures for a given security or index. Going beyond yield, sophisticated measures such as duration, option-adjusted spread, spread duration, and convexity are critical to assess a bond’s risk. For the purposes of providing calculations related to the evaluation of interest rate risk, a proprietary interest rate model was built to calculate individual bond and index level characteristics. These models rely on a market-based approach to the term structure of interest rates. Security prices used for index return calculation, as well as the terms and conditions used for security selection, are fed into the model. This approach is a useful tool when evaluating interest rate risk for bonds with embedded options. This can be illustrated by observing the volatility surface on Aug. 1, 2019, when the 10-year yield had its largest one-day drop in 2019 and CBOE 10-Year U.S. Treasury Futures volatility spiked 17%.

Our proprietary calculation engine leverages the Hull-White Model for evaluating interest rate risk. This market-based approach maintains a no-arbitrage principal to align with widely held market standards for interest rate modeling. The model holds certain advantages, namely a mean-reversion parameter and the ability to evaluate negative interest rates. Like other models, a series of assumptions are made. The key assumptions used are constant volatility and a normal distribution of interest rates. Each interest rate node is calculated using a trinomial lattice, with assumptions applied to the term structure of rates, volatility assumptions, and mean-reversion parameters. Calculations are based on the currency of the bond (e.g., USD-denominated bonds will be priced to a USD model). Future plans include expansion into multi-currency bonds and models that incorporate tax implications for individual investors.

The posts on this blog are opinions, not advice. Please read our Disclaimers.

Volatility and Performance of Options-Related Indexes in the 2010s

Contributor Image
Matt Moran

Head of Index Insights

Cboe Global Markets

As we enter the 2020s with interest in worldwide geopolitical volatility, here are some key points about volatility and the performance of options-related indexes the 2010s.

How Did Equity Volatility in the 2010s Compare to Volatility in Previous Decades?

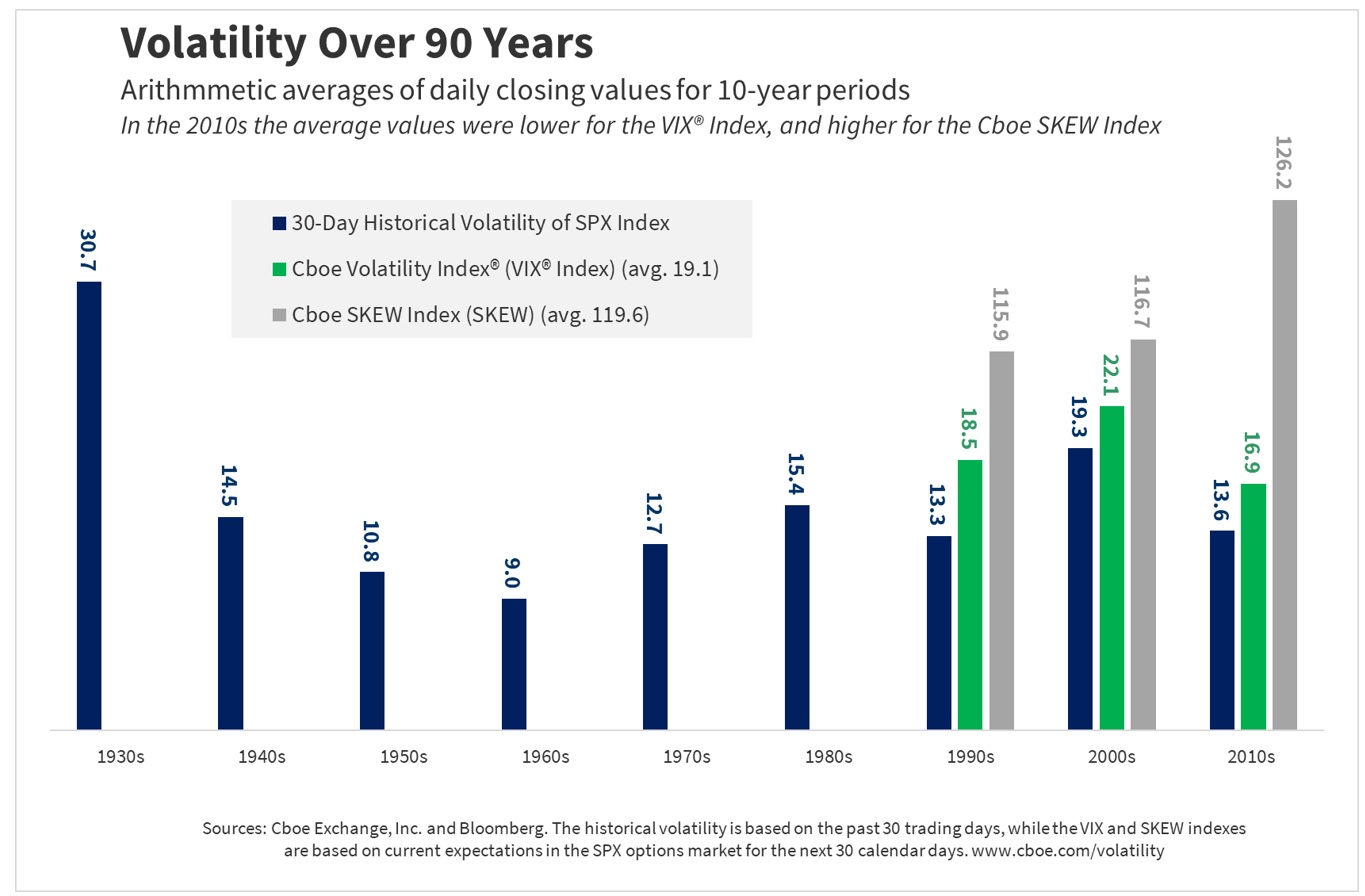
The average of the daily closing values of the VIX® Index in the 2010s was 16.9 (24% below the 22.1 average for the previous decade). In recent years some observers have questioned whether there was too much complacency in the markets, and if the VIX Index was unusually low in light of trade wars and geopolitical uncertainties. In answer to these questions, one could note that:

(1) The average of the daily closing values for the S&P 500® Index 30-day historical volatility was only 13.6 in the 2010s, but 16.2 over the past 90 years, (and the VIX Index arguably was not “low” when compared with historical volatility in the 2010s), and

(2) In the 2010s the average of the daily closing values of the Cboe® SKEW Index was 126.2 (about 8% higher than the previous two decades). The SKEW Index is a measure of the relative demand for tail risk protection. With the relatively high levels of the SKEW Index in recent years, it could be argued that there has not been too much market complacency regarding demand for tail risk protection.

SKEW, VVIX and VIX Indexes in the 2010s

In 2017 the VIX Index had its lowest average daily closing value for a year (11.1), but the SKEW Index had its highest average daily closing value for a year (134.8), with growth in the relative demand for tail risk protection.

Benchmark Indexes Over Ten Years

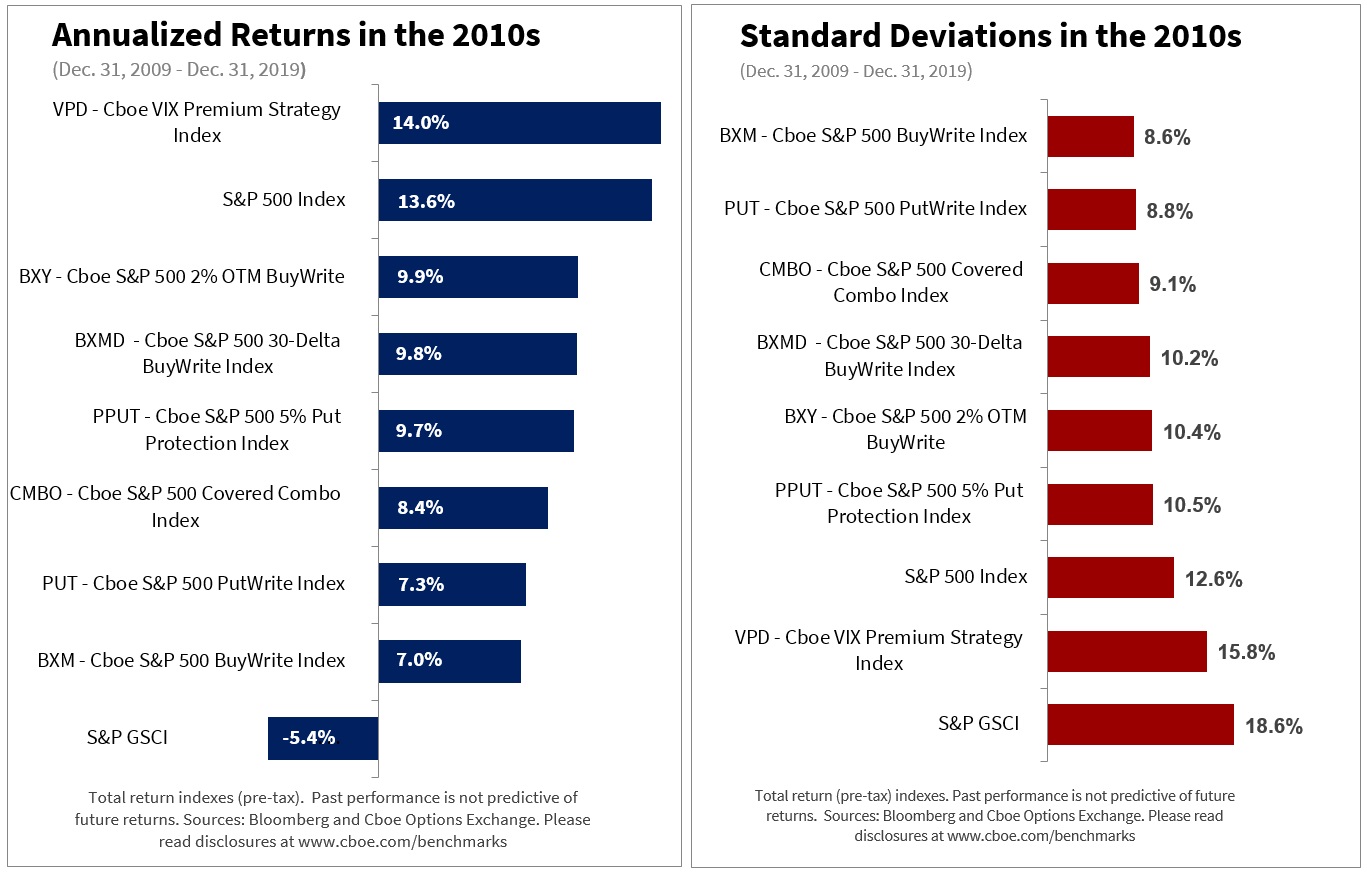
In the 2010s the VPDSM Index rose 271%, and the S&P 500 Index rose 257%.

Six indexes that use S&P 500 (SPX) options had the lowest standard deviations in the Standard Deviations chart below.

While the 2010s generally saw higher-than-average equity growth and lower-than-average equity volatility, a number of analysts have suggested that in the 2020s there may be less growth and more overall volatility.  Some indexes had less volatility in the 2010s, and this information may be useful to investors who are exploring ways to dampen their own portfolio volatility.

The posts on this blog are opinions, not advice. Please read our Disclaimers.

Latin America – 2019 in Review

Contributor Image
Silvia Kitchener

Director, Global Equity Indices, Latin America

S&P Dow Jones Indices

From a political and economic standpoint, 2019 was a challenging and interesting year for the Latin American region, but the region still finished strong. The S&P Latin America 40, Latin America’s blue-chip index, ended Q4 with a return of 9.0%, and it was up 13.9% for the year. Small-cap stocks in the region fared well, helping the broad S&P Latin America BMI return 11.1% for the quarter and nearly 22% for the year. Despite the strong performance, Latin American indices still lagged some of the global equity indices. The S&P 500® returned 9.1% for the quarter and an outstanding 31.5% for the year. The S&P Global 1200 yielded 8.9% for the quarter and 28% for the year. The S&P Emerging BMI also had a great year (up 19.9%), but still underperformed Latin America (as measured by the S&P Latin America BMI).

In 2019, all 11 GICS® sectors for Latin America posted positive returns, as measured by the S&P Latin America BMI Sector Indices. Some sectors yielded considerable returns; Health Care gained 22.0% for the quarter and was up 72.2% for the year. Information Technology and Real Estate were next, yielding 43.5% and 42.3% for the year, respectively. Materials had a strong quarter, returning 16%, which helped to bring the sector into positive territory for the year, ending with a mere 4.4%—the lowest annual return of the sectors.

Besides sectors, it is clear that Brazil’s positive performance was a big contributor to the overall performance of the region. Brazil not only had a stellar quarter with the local benchmarks, as the IBrX 100 and the S&P Brazil BMI both yielded around 11%, but the country also had a banner year, providing returns in the mid-30% range in local currency terms.

With the growing trend of factor indices in Brazil, we see that most did well for the year, and in most cases returns were above 40% in local currency and USD. However, the risk data was also high, particularly for the USD-denominated indices. Local investors took on less risk when removing the currency exchange rate from the performance calculation.

Chile was the worst performer amid the political unrest the country underwent during the last quarter. No headline index was unscathed, and they all ended the quarter and the year in the red. Hardest hit were mid-cap stocks, as measured by the S&P/CLX IGPA MidCap, which lost 14% for the quarter. The banking sector was hit particularly hard, with losses of 21%, as measured by the S&P/CLX Banks Index. The S&P/CLX Utilities & Telecom Index surprisingly gained 7.5% for the quarter and nearly 16% for the year.

Mexico, the second-largest market in the region after Brazil, had a good year. Mexico’s flagship index, the S&P/BMV IPC, returned 1.2% for the quarter and 4.6% for the year. The S&P/BMV FIBRAS Index, which seeks to track the performance of the local real estate income trust stocks, and the recently launched S&P/BMV Ingenius Index, which is designed to measure 12 of the most innovative companies in the world trading in Mexico, each had returned over 40% for the year. For the quarter, the S&P/BMV China SX20 Index had the best return, up 10.8%.

Among factor indices in local currency, the S&P/BMV IPC CompMx Short-Term Momentum Index and the S&P/BMV IPC CompMx Quality Index (each with 15 stocks representing the top companies within each factor) had returns of 16.5% and 18.4% for the year, both with relatively low risk.

Argentina was the most volatile market in the region in 2019, mostly triggered by the extreme depreciation of the Argentinian peso, the continuous increases in inflation rates, and the uncertainty following the recent change in government. For the year, the S&P MERVAL Index returned 37.6% in ARS. The Argentinian market generated the highest volatility data of the region, as the three- and five-year risk rates based on standard deviation for the S&P/BYMA Argentina General Index were 42% and 38%, respectively.

Finally, markets in Colombia and Peru had good years. The flagship indices, the S&P Colombia Select Index and the S&P/BVL Peru General Index returned 30.0% and 6.1% in local currency terms, respectively.

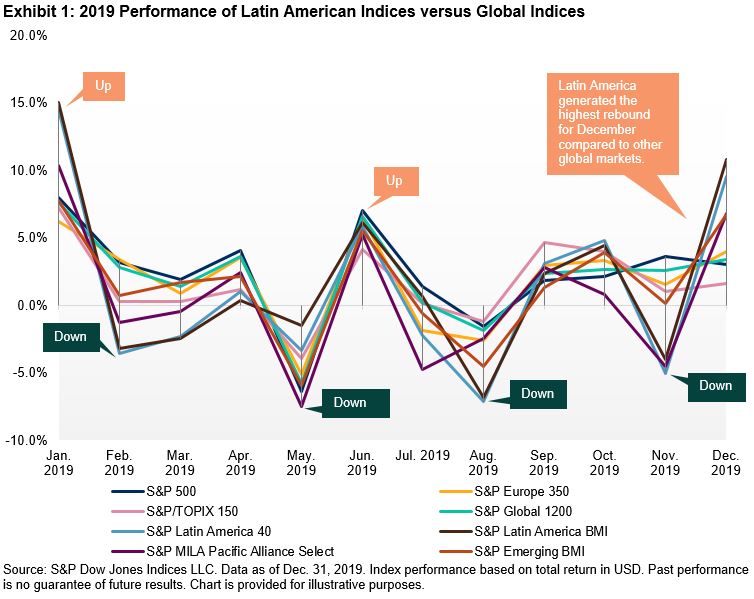
As a recap for the year, Exhibit 1 shows the performance of the three Latin American regional indices compared with other global equity markets and regions, based on monthly returns. Overall, we found that the markets were steady; the ups and downs were not as drastic as the previous year. The last month was particularly intense for Latin America, as the region experienced a strong recovery.

With the new year, new challenges and new opportunities arise. It will be interesting to see the development of these markets in the coming months.

The posts on this blog are opinions, not advice. Please read our Disclaimers.

Performance and Volatility for Sectors in the 2010s

Contributor Image
Matt Moran

Head of Index Insights

Cboe Global Markets

As we enter the 2020s, here are some key points about the 2010s –

  • The U.S. economy has expanded for a record 126 straight months, the longest time period in U.S. history, according to the National Bureau of Economic Research. The bull market in U.S. stocks has run about 10.7 years, one of the longest bull markets in history.
  • The 2010s were the first “decade” in at least 170 years that did not experience a U.S. recession.
  • However, overall U.S. economic growth (including job growth, wage growth and GDP growth) during the 2010s has been slower compared to some previous U.S. expansions.

Sector Indexes Over Ten Years

In the 2010s, Select Sector indexes that had strong performance and rose more than 340% included the Consumer Discretionary sector (its largest holdings include Amazon.com, Home Depot, McDonald’s and Nike), Technology (its largest holdings include Apple, Microsoft and Visa), and the new Communications Services sector (its largest holdings include Facebook, Alphabet, Netflix and Comcast).  In contrast, the Energy sector (with Exxon Mobil and Chevron) was up only 40% in the 2010s, as the spot price of a barrel of crude oil (WTI) fell 23% (from $79 to $61) during the 2010s.

In the right-side chart below, the indexes with the highest standard deviations were the S&P GSCI and the Energy Select Sector Index (SIXE) both of which were impacted by volatile oil prices.

Historic Volatility in the 2010s

In the final chart below, the averages of the 30-day historical volatilities were 20.8 for the Energy Sector, 16.0 for the Technology Sector, and 11.3 for the Consumer Staples Sector. The peak 30-day historical volatility on the chart was 55.67 for the Energy Sector on September 12, 2011; in 2011 the spot price for a barrel of crude oil (WTI) fell from $113.93 on April 29 to $88.19 on September 12.

In Conclusion

While the 2010s generally saw higher-than-average equity growth and lower-than-average equity volatility, a number of analysts have suggested that there may be less growth and more overall volatility in the 2020s.  Some sectors had less volatility in the 2010s, and this information may be useful to investors who are exploring ways to dampen their own portfolio volatility.

The posts on this blog are opinions, not advice. Please read our Disclaimers.

S&P and Dow Jones Islamic Benchmarks Finished 2019 with Standout Performance

Contributor Image
John Welling

Director, Global Equity Indices

S&P Dow Jones Indices

Shariah-Compliant Benchmarks Continued to Outperform Conventional Indices

Global S&P and Dow Jones Shariah-compliant benchmarks finished a standout 2019, a welcomed turnaround in comparison to the lackluster returns of the prior year. Broad-based Islamic indices outperformed their conventional counterparts in 2019 as Information Technology—which tends to be overweight in Islamic indices—led sector returns by significant margins, while Financials—which is underrepresented in Islamic indices—continued to trail behind the broader market. The S&P Global BMI Shariah and Dow Jones Islamic Market (DJIM) World Index gained 31.2% and 30.9%, respectively, outperforming the conventional S&P Global BMI by an excess of 400 bps.

U.S. and Europe Outperform YTD, Robust Emerging Market Gains in Q4

Among regions, the U.S. and developed market conventional equities led performance YTD. In the U.S., easing trade tensions and accommodation from the U.S. Federal Reserve renewed optimism about the economic outlook, while European equities prevailed with the help of the central bank stimulus and falling yields amid slowing growth and Britain’s ongoing struggles to map an exit from the EU.

Meanwhile, the DJIM Emerging Markets gained 12.9% during Q4 2019 alone, compared to the 10.0% gain logged by the DJIM Developed Markets during the same period, narrowing the gap between the benchmarks YTD.

MENA Country Results Varied

Although MENA equity returns (in USD) reversed the prior quarter’s losses during Q4 2019, the YTD return of 12.5%—as measured by the S&P Pan Arab Composite—lagged broad emerging market benchmark gains. The S&P Bahrain continued to lead the region YTD, with a gain of 44.1%, followed by the S&P Kuwait, which added 31.3%. The S&P Oman and S&P Qatar lagged the most, gaining merely 1.2% and 1.9%, respectively, YTD.

Varied Returns of Shariah-Compliant Multi-Asset Indices

The DJIM Target Risk Indices—which combine Shariah-compliant global core equity, sukuk, and cash components—generally underperformed the S&P Global BMI Shariah and DJIM World Index YTD. Performance of the comparably more risk averse DJIM Target Risk Conservative Index was constrained by its 20% allocation to global equities in the expanding market environment, ultimately gaining 13.8% YTD. Meanwhile, the performance of the DJIM Target Risk Aggressive Index was driven by its 100% allocation to a mix of Shariah-compliant global equities, favorably returning 31.0%, in alignment with the broader S&P Global BMI Shariah and DJIM World Index.

For more information on how Shariah-compliant benchmarks performed in Q4 2019, read our latest Shariah Scorecard.

A version of this article was first published in Islamic Finance News Volume 17 Issue 02 dated January 14, 2020.

The posts on this blog are opinions, not advice. Please read our Disclaimers.