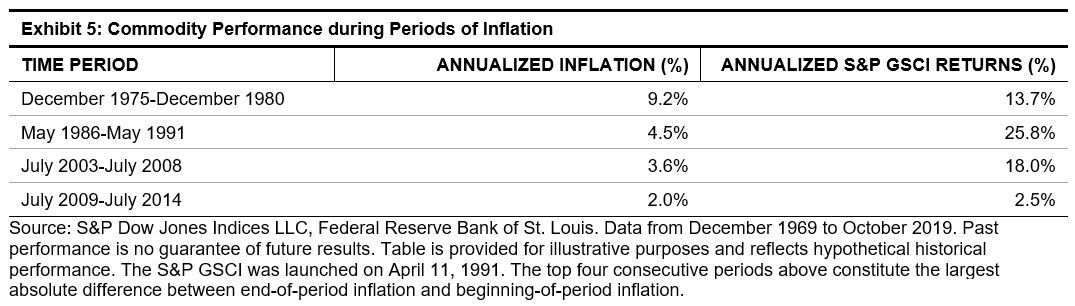
In this blog, we investigate the dispersion of carbon intensity scores in detail and its effect on carbon-efficient portfolio construction via equal- and market-cap-weighted approaches. A company’s carbon efficiency is measured by its carbon intensity score (C.I. score), provided by Trucost, which is defined as the greenhouse gas (GHG) emissions from a company’s direct operations and first-tier suppliers, measured in metric tons of carbon dioxide equivalent (CO2e) per USD 1 million of revenue (CO2e/USD 1 million).[1] Some sectors, by nature of business, such as such as Utilities, Materials, Industrials, and Energy are carbon inefficient (higher C.I. scores) while other sectors, such as Financials, Information Technology, and Consumer Discretionary, are more carbon efficient.
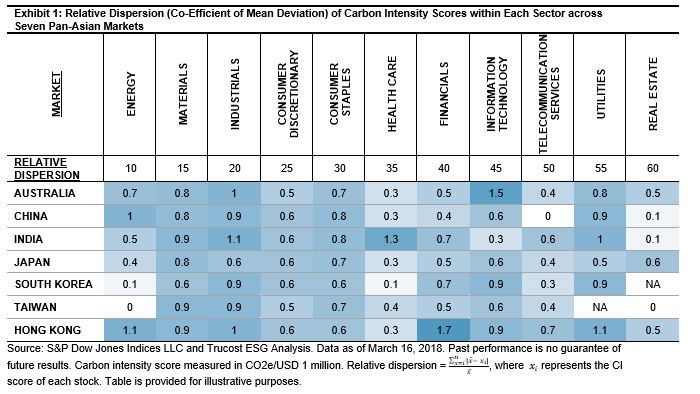
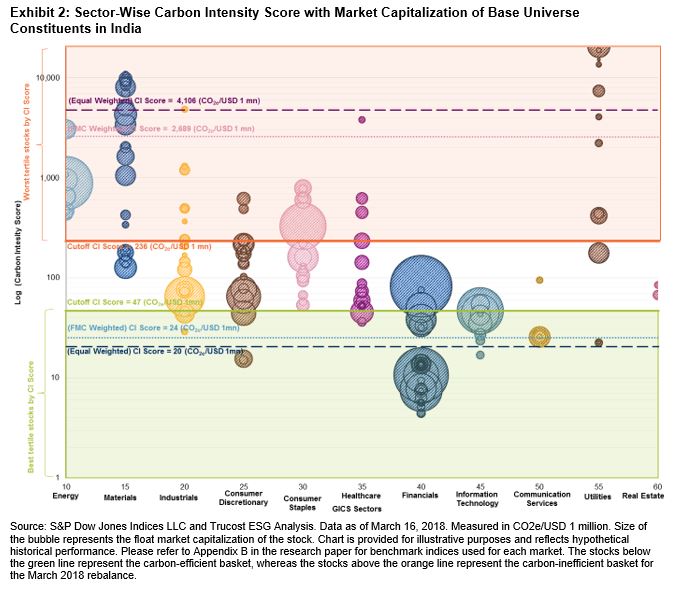
C.I. scores can be widely spread even within the same sector. Relative dispersion[2] is a metric that allows us to measure this spread by normalizing across sectors and markets. The relative dispersion seen across the seven markets studied for the March 2018 basket (see Exhibit 1) shows that, in most Asian markets, Materials, Industrials, and Utilities sectors had the highest relative dispersion. For example, Exhibit 2 shows that in the Utilities sector in India, the C.I. scores ranged from 23 to 26,948 CO2e/USD 1 million. Within the Utilities sector, the stock with the lowest C.I. score belonged to a company involved with the generation and sale of renewable energy, whereas the company with the highest C.I. score was involved with the generation of power though coal and gas in addition to solar, wind, and hydroelectricity. This is of particular importance, as it enables a sizeable reduction of the weighted C.I. score even in sector-neutral portfolio construction approach (though to a more modest extent when compared with unconstrained approach, which does not limit active sector exposures). In India, the C.I. scores of the unconstrained and the sector-neutral carbon-efficient portfolios were 24 and 155, respectively. (see Exhibit 3 in our recent research paper).
The wide spread in C.I. score and market capitalization also affected the weighted average C.I. scores of the carbon-efficient and carbon-inefficient tertiles across markets. For example, in India, for the March 2018 basket, the equal-weighted C.I. score for the carbon-inefficient tertile basket was 4,106 CO2e/USD 1 million, whereas the market-cap-weighted version of the C.I. score was 2,689 CO2e/USD 1 million (see Exhibit 2), implying that the large-cap companies in India had lower C.I. scores in the carbon-inefficient basket. Despite dominance by large-cap companies in the market-cap-weighted portfolio, a reduction in the weighted average C.I. score for the carbon-efficient portfolios versus their respective carbon-inefficient portfolios remained significant across all markets. (see Appendix E in our recent research paper).
This unique spread of C.I. scores within each sector in each market could drive investors to prefer constructing a carbon-efficient portfolio either via sector-unconstrained or sector-neutral selection processes. Furthermore, investors could opt to weigh equally, although those concerned with investability could potentially turn to the market-capitalization-weighing approach to portfolio construction in order to improve C.I. scores, and therefore preserve asset size scalability.
[1] Direct GHG emissions of an automobile manufacturer include the emissions from operation or production (e.g., welding, assembly of parts, painting, etc.), while the first-tier indirect emissions include emissions from supply chains and procurement, such as utilities, steel manufacturing, tires, spare parts, and business travel.
[2] Relative dispersion = ![]() , where represents the C.I. score of each stock.
, where represents the C.I. score of each stock.