Get Indexology® Blog updates via email.

In This List

Commodities – What to Watch for in 2020

Equity Markets React to the U.K. Election

Volatility Did Not Help Active Managers’ Persistence Scores

2019: A Market Review

Raising the Bar in Canadian Small Caps

Commodities – What to Watch for in 2020

Contributor Image
Fiona Boal

Managing Director, Global Head of Equities

S&P Dow Jones Indices

In this blog post, we present five eclectic thoughts for commodity investors to ponder as we look forward to the New Year and the start of a new decade.

  1. S&P 500® versus S&P GSCI

Similar to the 1990s, the last decade saw equities radically outperform commodities. Prior to that, the 2000s were more volatile, with large variations in the ratio of the S&P GSCI to the S&P 500. Could the new decade echo in a period of mean reversion for this ratio? There are several conducive factors present in the global commodity markets. These factors include geopolitical and populist tensions rising globally, several commodities trading at their cost or break-even levels, and supply risks accelerating due to continued climate change.

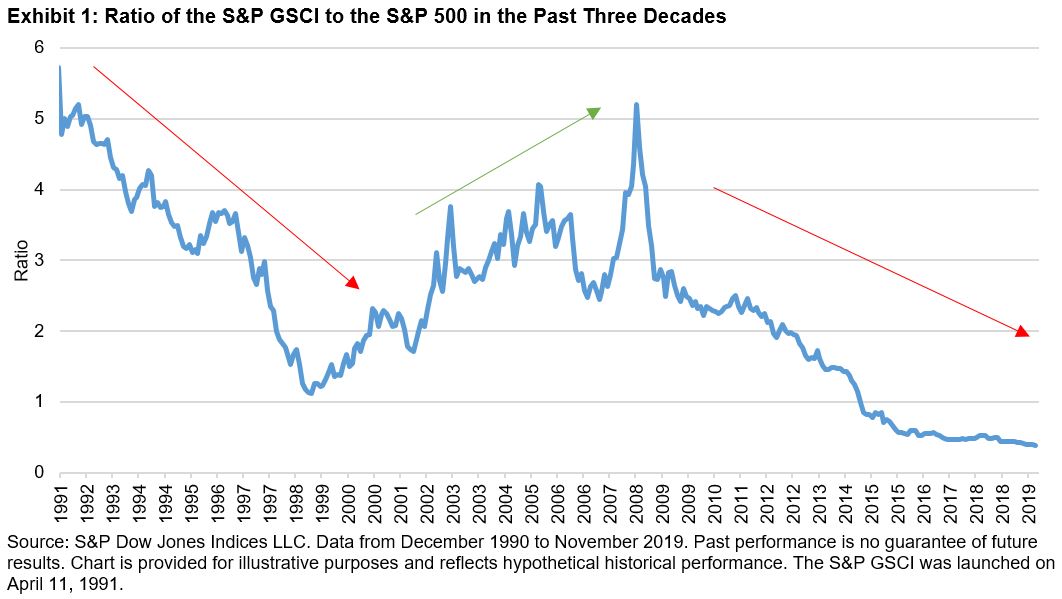
It has been difficult to compete against the bull equity market. However, with mixed political, trade, and economic news, there is an argument to be made that the long-held benefits of diversification may come back to the fore and commodities may re-emerge as one of a number of diversification instruments available to investors.

  1. Commodity Equities or Commodities

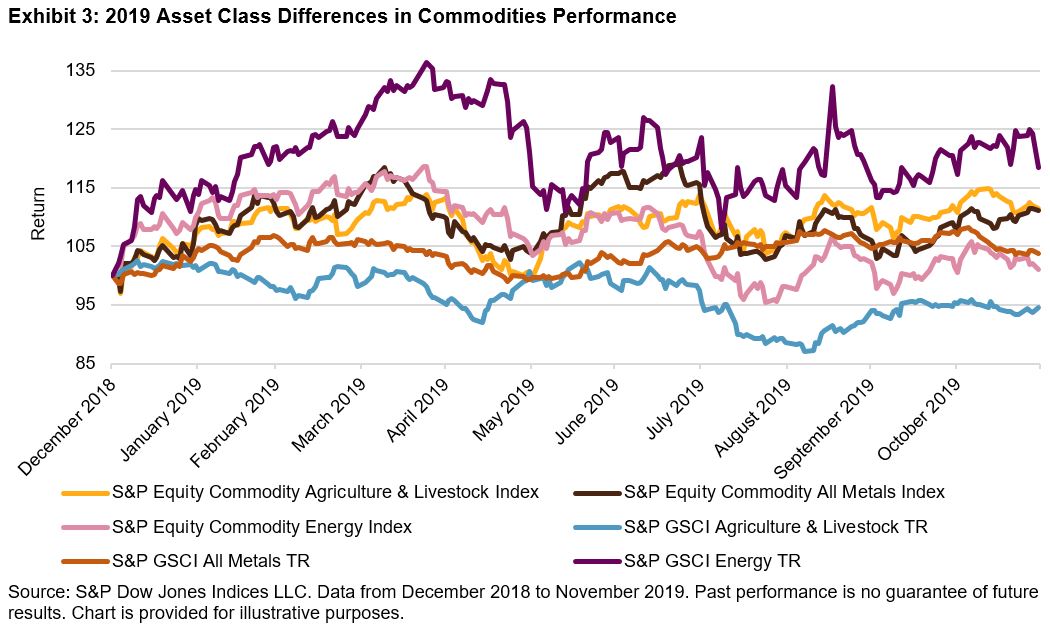
On a more granular level, in 2019, there have been some noticeable differences in the performance of individual commodity futures and their complementary equity sectors. Exhibit 2 reflects the S&P GSCI subcomponents of energy, agriculture and livestock, and precious and industrial metals in the futures column. For the equities column, we chose the corresponding S&P DJI equity commodity sector indices.

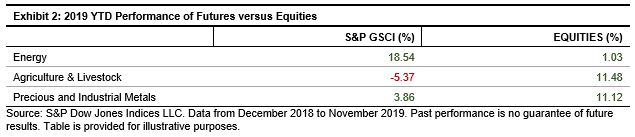
Looking at Energy, petroleum prices climbed this year due to sanctions on Iran and Venezuela as well as continued OPEC+ production cut compliance. However, equities underperformed due to bearish market sentiment, with high debt levels present across the sector. Our colleagues at S&P Global Ratings expect Energy to lead in terms of defaults over the next five years. Energy has been the worst-performing sector this year, while the S&P 500 has made several new highs. Agriculture and livestock merger and acquisition (M&A) activity and broad equity market support gave these equities the impetus to move higher regardless of the move lower in physical agricultural and livestock prices. The futures were affected by the ongoing U.S.-China trade war, heavy levels of supply, and the African swine flu outbreak. In contrast, precious metals were notably higher and the large gold miners benefited handsomely from higher gold prices.

For market participants looking for commodity exposure, it is important to consider the different instruments available to them. As 2019 has shown, the factors affecting commodity equities can extend well beyond the supply and demand dynamics of the underlying commodity.

  1. Natural Gas – A Hard Lesson in Curve Structure

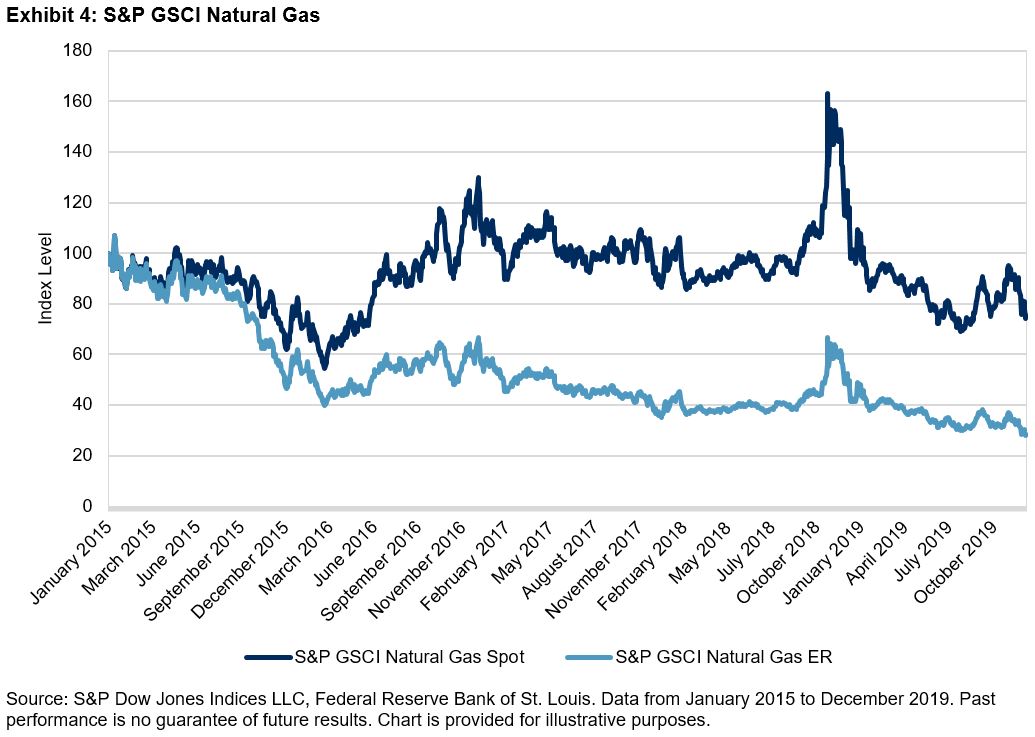
It looks likely that natural gas will end the year with the poorest performance of all the single‑commodity S&P GSCI constituents. By the middle of December 2019, the S&P GSCI Natural Gas was down an eye-watering 31% for the year. As has been the case for many years, chronic contango in the natural gas futures curve contributed significantly to the persistent underperformance of index returns compared with spot prices for natural gas. According to our colleagues at S&P Global Platts, 2020 will be the first year when gas demand growth, including sizable liquefied natural gas (LNG) feedgas demand growth, exceeds gas production growth in the U.S. It remains to be seen if this switch in dynamics is sufficient to flip the futures curve from contango to backwardation, but there is little doubt that the ongoing growth in LNG demand has the potential to change the dynamics of the broader natural gas market.

  1. Inflation Protection – Will Investors Ever Need It Again?

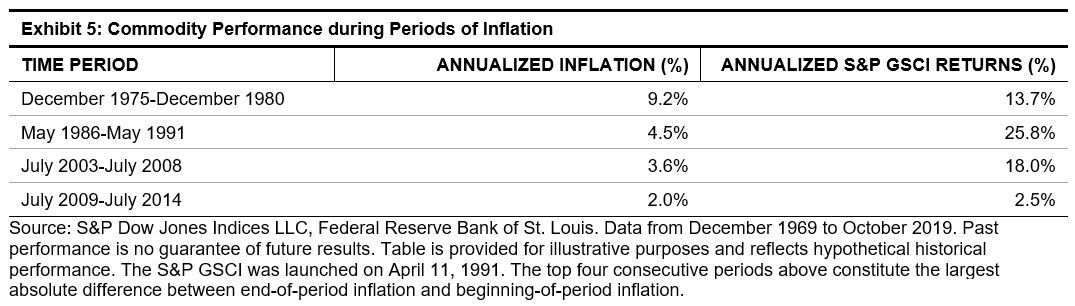
The current low-inflation environment may be unjustifiably penalizing commodities as a long-term inflation hedge. Inflation can be notoriously difficult to forecast, and market participants can experience an inflation shock before inflation expectations are adjusted upward. Inflation across the major global economies has been in a coma for many years, and negative bond yields would suggest that few investors have inflation at the top of their list of worries heading into the New Year. However, consider that a litany of headwinds—the trade war, Brexit, the slowdowns in Europe and China—if they accelerate, it could encourage levels of domestic fiscal stimulus that may stoke inflation expectations. It’s a long shot, but not out of the realm of possibility.

  1. IMO 2020

With the first major regulation hitting fuel markets since the removal of lead in gasoline in 1973, market participants have become concerned about potential volatility that may be on the horizon in petroleum markets. The new IMO 2020 rule requires container ships to switch from fuel made with 3.5% sulfur to 0.5% unless they are equipped with exhaust-cleaning scrubbers. Most shippers will comply by switching to very low sulfur fuel oil or marine gasoil. With demand picking up for sweet crude grades like WTI and European Brent, which produce higher levels of distillates, there has already been a divergence of prices between sweet crude grades and sour crudes from countries such as Canada, Mexico, and Venezuela.

Outside of the impact on the petroleum market, it will be fascinating to see what impact, if any, these new regulations have on global shipping markets beyond higher marine transport costs. With approximately 90% of the world’s trade carried by sea, any type of disruption could, in the worst case, be an unwelcome drag on global economic activity.

The author would like to thank Jim Wiederhold for his contribution to this blog.

The posts on this blog are opinions, not advice. Please read our Disclaimers.

Equity Markets React to the U.K. Election

Contributor Image
Tim Edwards

Managing Director, Index Investment Strategy

S&P Dow Jones Indices

At the General Election on Thursday, U.K. voters handed a resounding victory to Boris Johnson’s Conservative party.  The British electorate awarded the party with 365 out of 650 seats, the largest outright majority of any U.K. government since 2001, and the biggest victory for the Conservative party since Margaret Thatcher’s final victory in 1987.

Exhibit 1: Johnson wins largest Conservative Majority Since 1987

For once, the polls largely got it right.  A conservative majority had been predicted ever since Johnson’s elevation to Prime Minister on July 23rd, 2019; the market’s reaction on Friday continued along the line of established trends.   Exhibit 2 shows selected winners and losers from Friday’s trading, as well as the cumulative performance of the same indices since the mid-summer.

Exhibit 2: U.K. Equity Election Winners and Losers  

In signs that the market believes the U.K. economy may benefit in the near-term, smaller U.K. companies outperformed larger companies, and companies with more domestically-focused revenues outperformed those with a more international customer base.  Airlines, which had been hammered by the twin threats of a “no deal” Brexit and the Brits’ diminishing holiday purchasing power, soared.  Meanwhile the automobile industry, perhaps nervously anticipating the focus of U.S. / U.K. trade talks, added to the recent declines.

With the pound sterling moving 7% over the past five months, it is tempting to wonder if currency movements (and sensitivities to exchange rates) offer a universal explanation for the recent, relative performances of British equities.  Even in U.S. dollar terms, however, U.K. companies tilted towards domestic customers have made significant gains since June, rising by more than a quarter in total return.  Over the same period, internationally-focused U.K. firms finished flat.

Exhibit 3: Domestic U.K. Firms Have Risen 25% in U.S. Dollar Terms Since June

The U.K. economy, widely viewed as a difficult and stressful place to invest during the fragile governments of former Prime Ministers May and Cameron, may be becoming “investable” once more as the impasse in parliament unblocks.  However, there remains much to do before the U.K. can emerge from negotiations with its European partners.  While the current focus is the exit terms from the trading bloc, a negotiation on the terms of future trade must follow.

The posts on this blog are opinions, not advice. Please read our Disclaimers.

Volatility Did Not Help Active Managers’ Persistence Scores

Contributor Image
Berlinda Liu

Former Director, Multi-Asset Indices

S&P Dow Jones Indices

While many investors appear to believe that winners persist over time, the most recent S&P Persistence Scorecard underscores the well-known disclaimer that “past performance is no guarantee of future results”: irrespective of asset class or style focus, few fund managers consistently outperformed their peers.

Some market participants believe that active managers with successful track records should have the skills to benefit from different market environments. However, volatility in the one-year period ending September 2019 did not help their persistence scores.

The market experienced ups and downs in the past year amid the uncertainty over Fed policy and trade tensions between the U.S. and China. The sell-off in the fourth quarter of 2018 was offset by the strong rally in the first six months of 2019, the best-performing first half of a year since 1997. For funds categorized as top performers in September 2017, 47% maintained their top-quartile performance in the subsequent year. However, there was a dramatic fall in persistence afterward—just 8% of domestic equity funds remained in the top quartile in the three-year period ending September 2019. Given that the random odds of a top-quartile manager in year one staying in the top quartile in the subsequent two years is 25% * 25% = 6.25%, it appears that top managers in the rising market prior to Q4 2018 navigated the subsequent market turmoil only marginally better than a random drawing.

The S&P Persistence Scorecard also shows that a decline in persistence scores was prominent in small- and mid-cap funds when compared with results from March 2019.

Over a longer investment horizon, we observed even lower performance persistence. At the end of the five-year measurement period, only 0.88% of all domestic equity funds maintained their top-quartile status. No large-cap fund was able to consistently deliver top-quartile performance by the end of the fifth year.

Our latest persistence scorecard highlights the challenge for active managers to consistently beat their peers. If a market participant selects a manager based only on past performance, the chance that the manager would remain in the leading pack is not a far cry from a random drawing.

For more information on performance persistence in U.S. active funds, read our latest Persistence Scorecard.

The posts on this blog are opinions, not advice. Please read our Disclaimers.

2019: A Market Review

Contributor Image
Hamish Preston

Head of U.S. Equities

S&P Dow Jones Indices

With 2019 coming to a close, market participants may use the time to evaluate portfolio performance and to assess what changes (if any) they would like to make based on return expectations and the market outlook.  While the future is uncertain – hindsight really will be 2020 when it comes to evaluating next year’s returns – 2019’s market movements can provide context for where we are and where we may be headed.

2019 has been positive for U.S. equities

In contrast to the gloomy market outlooks to start the year, 2019 has been almost entirely positive for U.S. equities.  The S&P 500 has posted 26 all-time high closing price levels and currently boasts a 27.4% year-to-date total return, while the S&P MidCap 400 (+22.89%) and the S&P SmallCap 600 (+19.90%) have also gained.  More broadly, 42 of the 45 style and sector indices based on the S&P 500, S&P 400, and S&P 600 have risen so far in 2019:  smaller energy companies and small-cap communication services stand as the exceptions.

The Fed, trade tensions, and earnings have driven sentiment so far this year

Despite the broad-based gains in U.S. equities, there have been a few bumps along the way as expectations over future Fed policy, U.S.-China trade tensions, and corporate earnings have taken it in turns to drive sentiment.

For example, better-than-expected corporate earnings, easing trade tensions, and signs of economic growth initially helped the S&P 500 to its best total return through the end of April since 1987, up 18.3%.  But the market was gripped by a case of “he said, Xi said” in May: comments from President Trump and President Xi raised the prospects of tit-for-tat tariffs and led the S&P 500 to a 6.4% monthly decline.

Over the summer, Jerome Powell’s comments that the Fed would “act as appropriate to sustain the expansion” heralded a return to bad news is good news.  Underwhelming economic data fueled expectations for future rate cuts, which in turn were expected to have a positive impact on equities.  This supported the S&P 500 during its best June performance since 1955 – its 7.1% monthly gain also coincided with optimism that trade tensions would ease after the U.S. and China met at the June’s G20 summit.

More recently, the market put its disappointment about July’s “mid-cycle adjustment” in the rear-view mirror:  the S&P 500 recorded 6 consecutive weekly gains as the market got the rate cuts it expected, earnings largely beat expectations, and trade tensions eased.

2020 to be a stock-pickers market? Maybe not

The idiosyncratic reactions of companies to the various drivers of recent market returns has contributed to a decline in correlations.  Some have argued that this means 2020 will be the year of the stock-picker, but this argument is not new: hope springs eternal for active managers.

As we have shown before, a better measure of active management’s alpha opportunity is dispersion:  a greater proportion of large-cap active managers typically underperformed the S&P 500 when dispersion was lower.  Given U.S. large-cap dispersion has remained subdued so far this year, the current environment may pose challenges for many large-cap active managers.

Thank you, Jack Bogle!

Finally, no review of 2019 would be complete without a mention of one of the titans of indexing, John C. Bogle, who died in January.  In the words of Warren Buffett:

“If a statue is ever erected to honor the person who has done the most for American investors, the hands-down choice should be Jack Bogle”.

The posts on this blog are opinions, not advice. Please read our Disclaimers.

Raising the Bar in Canadian Small Caps

Contributor Image
Michael Orzano

Head of Global Exchanges Product Management

S&P Dow Jones Indices

Prior research has demonstrated that profitability matters for small-cap companies in the U.S. and in global equity markets. For example, the S&P SmallCap 600®—which includes an earnings eligibility criteria—has outperformed the broader Russell 2000 Index (with lower volatility) over its 25-year track record.

Our new S&P/TSX SmallCap Select Index extends this phenomenon to Canadian equities, where we have found that a similar effect exists. Simply put, filtering out the “junk” makes a big difference in Canadian small caps. Exhibit 1 illustrates the total return improvement and volatility reduction of the S&P/TSX SmallCap Select Index versus the broader S&P/TSX SmallCap Index over the past 15 years.

How Does the S&P/TSX SmallCap Select Index work?

The index follows the same methodology framework as our existing S&P SmallCap Select Index Series, but uses the S&P/TSX SmallCap Index as its selection universe. In order to be eligible for index inclusion, companies must post two consecutive years of positive earnings per share. As a buffer, companies are dropped from the index after posting two consecutive years of negative earnings. In order to improve replicability of the index, we also eliminate the 20% smallest and 20% least liquid companies. The index is weighted by float market cap and is rebalanced semiannually in June and December.

As of the June 2019 index rebalancing, the S&P/TSX SmallCap Select Index included 100 of the 199 companies in the S&P/TSX SmallCap Index and captured about 65% of the float market cap of the benchmark index. As shown in Exhibit 3, the majority of the exclusions were driven by the positive earnings requirement.

To learn more about the impact of including a positive earnings requirement in Canadian small caps, please see our recently published short paper that introduces the S&P/TSX SmallCap Select Index.

The posts on this blog are opinions, not advice. Please read our Disclaimers.