Consistently outperforming the S&P 500® is difficult. The S&P Dow Jones Indices SPIVA report shows that less than 18% of funds outperformed the S&P 500 (SPX) over the five-year period ending 12/31/2018. So how is it that the S&P 500 Equal Weight Index (SPEWI), a passive index comprised of the very same 500 stocks, accomplished what so few active managers have been able to do, outperforming the S&P 500 in 13 of 19 years from 2000-2018[1]? And how can understanding the nature of that outperformance yield further portfolio innovation?
Through selling winners and buying losers to parity each quarter, equal-weighting attempts to address a core inefficiency of cap weighted indices, which by definition – systematically over-weight, overvalued companies. While it is impossible to identify ahead of time which companies are the overvalued ones, the index should take the mathematical loss over time.
When viewed through this lens, it’s apparent that exploiting the allocation inefficiency of Cap Weighting through Equal Weighting is only a half measure.
The opposite of “Cold” isn’t “Room Temperature,” it’s “Hot.”
The Reverse Cap Weighted Index (Reverse), which as the name implies – reverses the order of the S&P 500 through weighting by 1/Mkt Cap, takes exploiting that inefficiency one step further. In direct contrast to Cap Weighting, Reverse by definition – systematically over-weights undervalued companies. More information on Reverse Cap Indexing can be found here. The net result of weighting a portfolio in this manner is effectively a contrarian play within the S&P 500, as the largest companies/industries in SPX would be the lowest weighted within the Reverse Index.
Historically, in environments in which SPEWI outperforms SPX, we would expect Reverse to outperform them both. Conversely, in environments where SPX outperforms SPEWI (as is the case over the last three years) we would expect Reverse to be the worst performing of the three. Below is a chart detailing the performance of the three indices from 12/31/1996 – 6/30/2019.
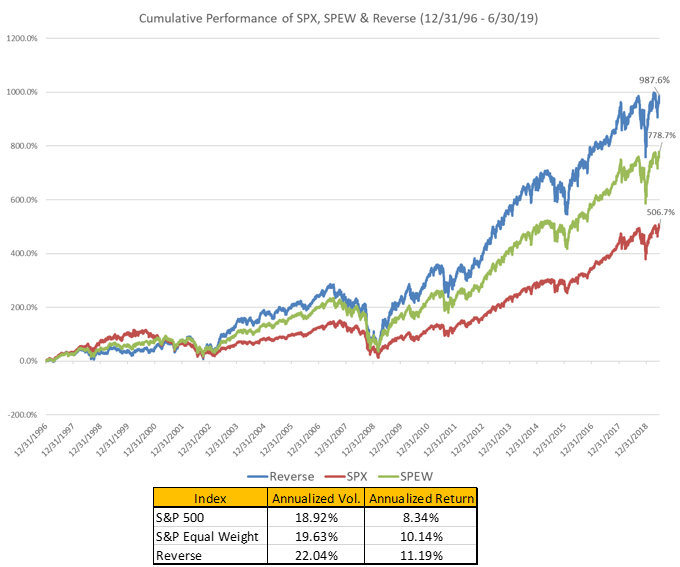
Note: S&P EWI has an index launch date of 1/8/2003 and Reverse has an Index launch date of 10/23/2017. Both Indices are licensed and calculated by S&P Dow Jones Indices and all information for the Indices prior to its Launch Date is back-tested by S&P DJI, based on the methodology that was in effect on the Launch Date. Standardized performance for S&P 500, S&P EWI, and REVERSE can be found by clicking the respective link. Risk & Return data sourced from Bloomberg. All figures represent Total Return of the indices.
Consistent with this expectation, just as SPEWI has outperformed SPX with additional volatility, Reverse was the best performing of the three alongside the highest volatility of group. While the total return figure demonstrates the robustness of the outperformance, the below daily 5-year rolling return chart shows the consistency of that outperformance, with Reverse being the highest returning of the three indices in 78% of the observed data points.

Note: S&P EWI has an index launch date of 1/8/2003 and Reverse has an Index launch date of 10/23/2017. Both Indices are licensed and calculated by S&P Dow Jones Indices and all information for the Indices prior to its Launch Date is back-tested by S&P DJI, based on the methodology that was in effect on the Launch Date. Standardized performance for S&P 500, S&P EWI, and REVERSE can be found by clicking the respective link. Risk & Return data sourced from Bloomberg.
This additional return (and the relationship to SPEWI) is partially derived from the higher Size (SMB), Value (HML) and Anti-Momentum (MOM) factor loads expressed in the Reverse Index, relative to the other S&P weighting schemes. Reverse merely places additional load on the factors that drive differentiation between SPEWI and SPX. These findings (as they relate to SPEWI and SPX) are consistent with prior S&P DJI research.[2]

Note: S&P EWI has an index launch date of 1/8/2003 and Reverse has an Index launch date of 10/23/2017. Both Indices are licensed and calculated by S&P Dow Jones Indices and all information for the Indices prior to its Launch Date is back-tested by S&P DJI, based on the methodology that was in effect on the Launch Date. Standardized performance for S&P 500, S&P EWI, and REVERSE can be found by clicking the respective link. Fama-French factor portfolios are from the Ken French Data Library.
While SPX represents an operationally efficient index, Reverse takes the well understood elements of SPEWI (which exploit the investment inefficiencies of Cap Weighting), one step further and provides a unique contrarian play within the S&P 500 universe.
[1] Calendar year returns were calculated from 2000 through 2018.
[2] Edwards, T., Lazzara, C., Preston, H., and Pestalozzi, O. “Outperformance in Equal-Weight Indices.” S&P Dow Jones Indices LLC. January 2018.