Get Indexology® Blog updates via email.

In This List

Implied Plunge Protection

2019 Mid-Year Persistence Scorecard - Key Highlights

Corn Pops to a New High

Understanding the ESG Consequences of Factor-Based Investing: Part 2

S&P and Dow Jones Islamic Market Indices Largely Outperformed Conventional Indices in Q2 2019

Implied Plunge Protection

Contributor Image
Tim Edwards

Managing Director, Index Investment Strategy

S&P Dow Jones Indices

Ever since its formation in response to the “Black Monday” crash of October 1987, the United States “Working Group on Financial Markets” has been accompanied by (persistently-denied) rumours that the group used government funding to make large equity purchases whenever the market fell – giving rise to its informal moniker of the “Plunge Protection Team”.  While few still believe that the original “PPT” are busy buying the dips, a modern version may have emerged in the current combination of U.S. political and fiscal priorities.  The effect is most visible in the collapsing cost of insuring against large downside moves in the S&P 500®.

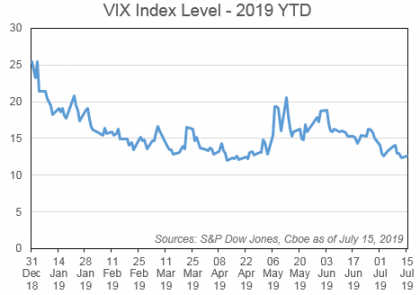
The Cboe Volatility Index (“VIX®”) provides a highly useful snapshot of short-term risk sentiment for the S&P 500 – it provides the “implied” annual volatility of the S&P 500 price index over the next month.  If volatility expectations are higher, the chance of a large down day increases.  After rising in December, VIX has been grinding down recently, closing on Monday at a paltry 12.68.

Exhibit 1: Cboe Volatility Index (VIX) year to date as of July 12th, 2019

If equity returns were normally distributed, then volatility would be all one needed to know to describe equity risk.  However, they aren’t, and so it isn’t.  Instead, equity returns are negatively skewed: declines three standard deviations below the mean have occurred much more frequently than gains three standard deviations above the mean.   In fact, if we take the prior day VIX as a prediction for the next day’s (annualized) volatility, declines that should be much more rare have occurred once or twice each decade.

Exhibit 2: “Impossible” daily moves in the S&P 500 (Jan 1990 – Jun 2019)

Note that although September 2008’s single-day decline of 8.79% is the largest in absolute terms, it was not the most “surprising” in our sample: the high reading of VIX on the previous day was already sounding the alarm of higher standard deviations.

Taking Skew into Account

If “tail” events are more likely than we would otherwise expect, we need to know how likely it is that a 3, 4 or 5-standard deviation move might occur (or at least, how much it costs to insure against one).  Conveniently, there’s an index for that!  The Cboe SKEW index uses the prices of S&P 500 options with different strikes to derive an implied “skew” of the distribution of future returns.  While skew has a formal mathematical definition, for practical purposes what we need to know is that its magnitude reflects the implied probability of a multiple-standard deviation loss.  Here is a chart of the implied 1-month skew in the S&P 500 for the past 15 years; we plot a 60-trading day average to illustrate the broader trend.  Notwithstanding a few bumps along the way, the series gains gradually from late 2008 through to a peak last September, but has fallen dramatically since then.

Exhibit 3: The 2019 Collapse in S&P 500 Skew

The perspectives of skew and volatility provide two dimensions in which the market can warn of a large decline.  VIX measures the cost of protection in general, whereas skew tells us if protection against larger moves is especially expensive relative to smaller moves.   Since surprises can occur even when we don’t expect them, skew has historically tended to reach its highest readings when VIX was low.  Exhibit 4 demonstrates this phenomenon based on daily closing levels over the past 15 years; the levels since the start of June 2019 are highlighted.

Exhibit 4: VIX and skew, historic and recent

What Exhibit 4 illustrates is that – at present – options linked to the S&P 500 imply that we’re set for low volatility, and unusually low skew compared to recent times.  That means that the market is charging considerably less than usual to insure against large down movements, and while market sentiment regarding risk can certainly be wrong, it does help explain what is going on at present.

Plunge Protection … but for how long?

Of course, it is one thing to note that the market doesn’t seem worried about a nasty shock, and quite another to speculate on the causes of such potential complacency: there is a very obvious candidate provided by the combined efforts of politicians and central bankers.

The U.S. Federal Reserve has committed to keep the economic expansion going, boosting market confidence that they will turn on the taps in response to equity weakness.  The Fed’s change in course in January after the equity market selloff was a major indicator here, as was the “good news is bad news” reaction that markets gave to a healthier-than-expected jobs figure on July 5th.

But the Fed is not going it alone; the Trump administration has made it clear that they view the equity market’s performance as a validation of their efforts to support the economy, and would appear to have a keen desire to keep the markets rising at least until the Presidential election.  The combined efforts of both fiscal and monetary powers seem aligned in an effort to prevent downside equity moves … at least in the near term.

The posts on this blog are opinions, not advice. Please read our Disclaimers.

2019 Mid-Year Persistence Scorecard - Key Highlights

Contributor Image
Hamish Preston

Head of U.S. Equities

S&P Dow Jones Indices

When it comes to investing, market participants often consider past performance to be indicative of future results.  The same goes for fund selection.  Notwithstanding the evidence showing that most active managers in most regions typically underperformed their benchmarks, consistently beating peers is one way to differentiate a manager’s luck from skill.  Here are a few highlights from our newly released Persistence Scorecard, which examines the extent to which funds that outperformed their peers maintained their status thereafter.

1. Shorter-term performance persistence rose but was absent in many categories over longer horizons.

Over the three-year period ending March 2019, there was an uptick in the performance persistence of smaller-cap equity managers compared with results from six months prior:  23.3% (versus 7.7%) and 13.7% (versus 4.0%) of small- and mid-cap equity managers, respectively, remained in the top quartile during the three-year period ending March 2019.  But showing how difficult it can be to beat peers over longer horizons, zero top quartile large-, mid-, and multi-cap equity funds maintained their status at the end of the five-year measurement period.

2. Top performing funds were more likely to become the worst-performing funds than vice versa.

Exhibit 2 provides a breakdown of the movements between quartiles over two non-overlapping five-year periods for domestic U.S. equity funds.  More than 50% of all top quartile funds became bottom half funds, with 31.53% moving to the bottom quartile.  This suggests that market participants may wish to be careful when using past outperformance as a guide for future results.

Additionally, Exhibit 2 highlights the potential challenges with betting on a turnaround in a fund’s performance.  While 15.26% of bottom quartile funds moved to the top quartile, 26.51% were merged or liquidated, higher than for any other category.

3. Many fixed income managers appeared to be wrong-footed by the bond market.

The bond market has gone through a turnaround recently; after a sustained period of tightening monetary policy, expectations changed in Q4 2018.  Concerns over growth and the potential impact of a trade war led many people to believe that the Fed would cut rates.  Against this backdrop, many fixed income managers that outperformed their peers as of March 2017 and March 2018 (when rate hikes were expected) were unable to maintain their status over the 12-month period ending March 2019.

As a result, our latest persistence scorecard shows just how challenging it has been for managers to consistently beat their peers, especially over longer horizons when market environments are more likely to change and competitors may become wise to (relatively) successful strategies.  Market participants may therefore find it useful to keep in mind that past performance is no guarantee of future results.

The posts on this blog are opinions, not advice. Please read our Disclaimers.

Corn Pops to a New High

Contributor Image
Jim Wiederhold

Former Director, Commodities and Real Assets

S&P Dow Jones Indices

Several catalysts, including U.S. Corn Belt production issues, drove corn futures prices to a new five-year high in June 2019. Investors were net short corn in May 2019, and the short covering contributed to the break higher. Prices broke through the 2017 peak after heavy floods in the Midwest prevented farmers from planting corn in a timely manner. While they have typically finished planting by May, this year U.S. farmers continued to plant until the end of June. As seen in Exhibit 1, it took a full extra month to get the crop planted. With new farming technology, farmers are able to plant 24 hours a day and can get the crop into the ground quickly when given the opportunity. This season, the new U.S. farmer bailout package encouraged farmers to continue planting even under less-than-ideal conditions because government payments are based on acres planted.

There are risks associated with planting corn so late in the season because it can negatively affect the final yield, and this is already apparent with 2019’s crop conditions. As can be seen in Exhibit 2, farmers are experiencing some of the worst crop conditions of the past five years. At this point in the season, we have not seen lower rated conditions since 2012. According to Farm Futures, growers continue rating crop conditions behind those reported in the USDA Crop Progress report. This leads to speculation about how the final crop will turn out, with the potential for a significant cut to supply affecting prices in the second half of 2019.

In past similar scenarios (like in 1995), corn prices moved higher throughout the growing season and the bull run continued into the end of the year after the harvest verified that the poor crop conditions had translated into a lower yield and a smaller crop. This year, much will depend on weather conditions over the remainder of the growing season and, possibly more importantly, the final acreage number. Many market participants expect that the final acreage level will eventually be adjusted lower to reflect the late planting pace.

The S&P GSCI Corn offers market participants the ability to capture these idiosyncratic movements. The index was up 12.655% YTD as of July 11, 2019. Supply shocks can drastically affect the price of the underlying commodities in agricultural markets. Tactical investments in commodities when the conditions are good offer an interesting return stream for investors. This recent move in corn is an example of how an allocation to commodities can do just that.

The posts on this blog are opinions, not advice. Please read our Disclaimers.

Understanding the ESG Consequences of Factor-Based Investing: Part 2

Contributor Image
Ben Leale-Green

Former Associate Director, Research & Design, ESG Indices

S&P Dow Jones Indices


In our previous blog, we looked at the S&P Factor Indices’ ESG exposures, showing that factor exposures can have an influence on ESG scores. In this blog, we’ll discuss these scores at the sector level and see how implementing an ESG or carbon reduction strategy on poorer ESG-performing factor indices can help investors gain not only factor exposure but desirable ESG exposures.

What Drives These Low Scores? 

Sector allocations are important for determining carbon metrics. Exhibit 1 shows how the weighted average carbon intensities of the 11 GICS® sectors differ. As with the carbon intensity data distribution, this is heavily skewed. The Utilities sector performs particularly poorly, with average emissions well over double the next-highest-emitting sector. Energy and Materials sectors also showed to be high emitting.

Understanding this, we can infer that factors with large exposures to Utilities, Materials, and Energy sectors are likely to have high carbon footprints.

When it comes to ESG scores, there is a sector bias. This sector bias shows how sectors in the S&P 500 compare to their global peers, as the data is normalized at the industry level based on the S&P Global LargeMidCap and S&P Global 1200 constituents. A skew is apparent, although not as strong as for the carbon intensities data (see Exhibit 2).

These sector skews of carbon intensities and ESG scores can potentially affect the factor indices, alongside other drivers such as stock-specific ESG characteristics.

How Constant Are the Sector Allocations within Factor Indices over Time?

The consistency of sector allocations is factor dependent. Exhibits 3-5 shows weight fluctuations in the Utilities, Materials, and Energy sectors for the various factors. The S&P 500 Equal Weight Index shows little fluctuation over time, whereas the S&P 500 Low Volatility Index and S&P 500 Momentum fluctuate significantly.

Overall, a responsible investor may wish to invest in strategy based on a quality-focused index. Alternatively, this investor may wish to implement an ESG or carbon reduction strategy for poorer ESG-performing factor indices, to gain not only factor exposure, but also desirable ESG exposures.

Furthermore, it could be beneficial to continually revise this type of analysis, since these ESG exposures will fluctuate over time, especially with those factors whose weights fluctuate to a greater degree. Ultimately, understanding the ESG consequences of factor exposure may lead to a more holistic investment approach.

The posts on this blog are opinions, not advice. Please read our Disclaimers.

S&P and Dow Jones Islamic Market Indices Largely Outperformed Conventional Indices in Q2 2019

Contributor Image
John Welling

Director, Global Equity Indices

S&P Dow Jones Indices

Developed Market Indices Continued to Outperform Conventional Indices, Emerging Markets Lagged

Global S&P and Dow Jones Shariah-compliant benchmarks outperformed their conventional counterparts YTD in 2019, as Information Technology—which tends to be overweight in Islamic indices—has been a sector leader, while Financials—which is underrepresented in Islamic indices—continued to underperform the broader market. The S&P Global BMI Shariah and Dow Jones Islamic Market (DJIM) World gained 18.4% and 18.0% YTD, respectively, outperforming the conventional S&P Global BMI by approximately 200 bps.

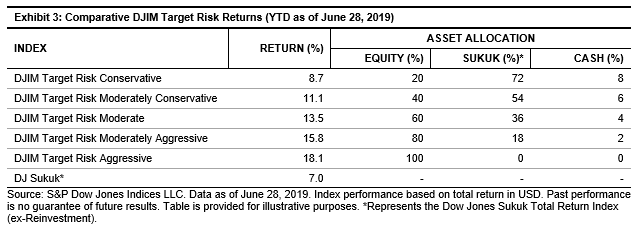
 The outperformance trend played out across major regions as Shariah-compliant benchmarks measuring U.S., Europe, Asia Pacific, and developed markets each continued to outperform conventional equity benchmarks by meaningful margins. Emerging markets and the Pan Arab region were exceptions, as Shariah-compliant benchmarks in these regions underperformed their conventional counterparts.

U.S. Equities Led the Rest of the World through Q2 2019

Following robust gains in Q1 2019, positive U.S. equity performance continued throughout Q2 2019, leading conventional global equities YTD. A continued dovish stance from the U.S. Federal Reserve and hopes of relief in U.S.-China trade negotiations helped push U.S. equities higher last quarter. European and Asia Pacific equities followed in performance, as each enjoyed healthy gains over the period.

MENA Equities Underperformed – Country Results Varied

MENA equities, as measured by the S&P Pan Arab Composite, lagged marginally behind emerging market equities YTD, with a gain of 12.2%. Following robust Q1 2019 performance, the S&P Bahrain continued to lead the region YTD, with gains of 25.1%, followed by the S&P Egypt BMI, which added 22.0%. The S&P Saudi Arabia, which was promoted to emerging market status in March 2019, gained a favorable 15.9%. The S&P Oman lagged most, falling 2.6% YTD, followed by the S&P Qatar, which rose 1.6% YTD.

Varied Returns of Shariah-Compliant Multi-Asset Indices

The DJIM Target Risk Indices—which combine Shariah-compliant global core equity, sukuk, and cash components—generally underperformed the S&P Global BMI Shariah and DJIM World YTD. Performance of the comparably more risk-averse DJIM Target Risk Conservative Index was constrained by its 20% allocation to global equities in the expanding market environment, and the index ultimately gained 8.7% YTD. Meanwhile, the performance of the DJIM Target Risk Aggressive Index was driven by its 100% allocation to a mix of Shariah-compliant global equities, with the index returning 18.1% YTD, in alignment with the broader S&P Global BMI Shariah and DJIM World.

For more information on how Shariah-compliant benchmarks performed in Q2 2019, read our latest Shariah Scorecard.

A version of this article was first published in Islamic Finance News Volume 16 Issue 27 dated July 10, 2019.

The posts on this blog are opinions, not advice. Please read our Disclaimers.