Get Indexology® Blog updates via email.

In This List

Using GARP Strategies for Indices Part III – Risk and Return

Positioning for Market Volatility Using Passive Strategies

Commodities Performance Highlights – March 2019

Using the S&P/JPX Dividend Aristocrats® to Invest in Japanese Dividend Growers

S&P 500® Has Best First Quarter in over 20 Years – But Upward Momentum Slows

Using GARP Strategies for Indices Part III – Risk and Return

Contributor Image
Wenli Bill Hao

Director, Factors and Dividends Indices, Product Management and Development

S&P Dow Jones Indices

In this blog, the third in our introduction to Growth at a Reasonable Price (GARP) strategies, we look at risk and return.

The main objective of the S&P 500® GARP Index is to capture the performance of growth stocks with relatively high quality and value composite scores over a long-term investment horizon. Historically, the GARP strategy has delivered higher returns than the underlying benchmark.

Rebasing all indices to 100 on June 30, 1995, the S&P 500 GARP Index reached 1,631.76 on Jan. 31, 2019, while the S&P 500 reached 777.91. In Exhibit 1, we compare the performance of the S&P 500 GARP Index with other factor indices—the S&P 500 Growth (855.24), the S&P 500 Enhanced Value Index (1155.30), and the S&P 500 Quality Index (1564.67).

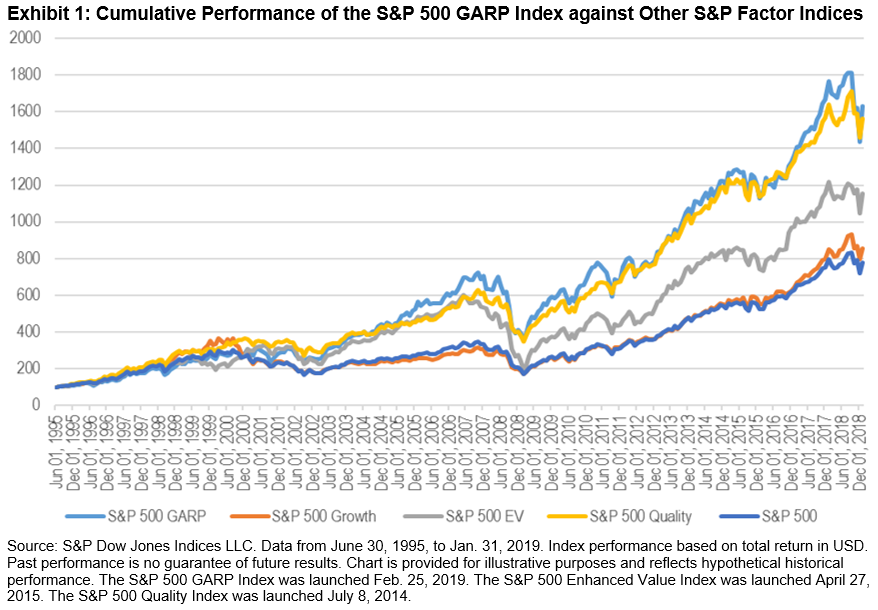
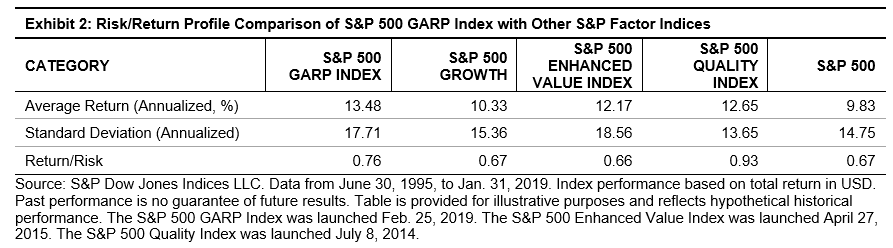
Exhibit 2 shows the average risk/return profile of the S&P 500 GARP Index against single-factor indices. The S&P 500 GARP Index had the highest annualized average return, at 13.48%. On a risk-adjusted basis, the S&P 500 GARP Index ranked second (0.76) after the S&P 500 Quality Index (0.93), but was higher than the other factor indices—the S&P 500 Enhanced Value Index (0.66) and S&P 500 Growth (0.67)—as well as the S&P 500 (0.67).

With the S&P 500 as the underlying benchmark, we can use the information ratio (IR) to evaluate whether a strategy was able to add value for each incremental unit of active risk taken (see Exhibit 3). The IR is defined as the expected active return divided by the tracking error (TE), where active return is the difference between the return of a strategy and the return of the S&P 500, and the TE is the standard deviation of the active return.

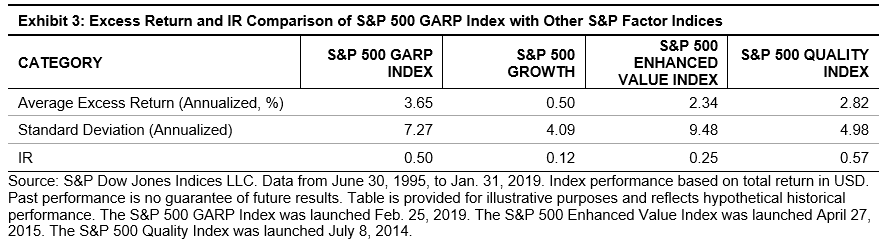
In Exhibit 3, the S&P 500 GARP Index had a positive IR of 0.50 over a long-term investment horizon. The index had a higher IR than the S&P 500 Growth (0.12) and S&P 500 Enhanced Value Index (0.25), but had a lower IR than the S&P 500 Quality Index (0.57).

In our next blog, we will continue to cover targeted factor exposures, sector composition, and performance attributions of the GARP strategy.

The posts on this blog are opinions, not advice. Please read our Disclaimers.

Positioning for Market Volatility Using Passive Strategies

Contributor Image
Rupert Watts

Head of Factors and Dividends

S&P Dow Jones Indices

Fluctuating periods of “risk-on” and “risk-off” mean that spikes in equity market volatility and large drawdowns are increasingly common in today’s economy. Exhibit 1 shows events throughout the current market cycle causing notable rises in volatility and large drawdowns. With more of these likely in the future, as our long bull market cycle ages, how do investors best position portfolios to respond?

Many investors are familiar with the passive indices that exist to gain broad market exposure in a low-cost, liquid, and transparent manner. But one question worth asking is which passive strategies have the potential to outperform during periods of negative equity performance and increased volatility? The good news is there are several.

S&P DJI offers a variety of indices specifically designed to help smooth out equity market drawdowns and improve risk-adjusted return. These indices can be divided into three broad categories: defensive equity, multi-asset, and volatility.

Exhibit 3 highlights and provides links to some of the indices that fall into these categories and shows their performance during Q4 2018—the most recent high volatility event. Many of the indices listed in Exhibit 3 posted material outperformance in Q4 2018.

Passive strategies can take on a much more dynamic role than simply offering broad market exposure. Investors can consider these strategies a valuable tool as they seek to weather periods of increased market volatility and large drawdowns.

For an overview of the indices shown in Exhibit 3, as well as an examination of their performance during other notable periods of increased volatility, please check out our new paper, “Seeking Volatility Protection Using Indices”.

The posts on this blog are opinions, not advice. Please read our Disclaimers.

Commodities Performance Highlights – March 2019

Contributor Image
Fiona Boal

Managing Director, Global Head of Equities

S&P Dow Jones Indices

It has been a noteworthy start to 2019 for commodities. The S&P GSCI was up 1.6% in March and up 15.0% YTD. The performance of the Dow Jones Commodity Index (DJCI) was more modest in March, up 0.1%, and it was up 7.5% YTD, reflecting its lower energy weighting. Petroleum prices were the standout driver of broad commodity index performance over the first three months of the year. In contrast, the agricultural commodities proved to be a drain on overall performance, and, while investor interest in precious metals remains well above previous years, price moves have been meek. The later part of the economic cycle is typically characterized by the outperformance of commodities, particularly industrial commodities (namely energy and industrial metals). This implies that the continued strength in commodities will be highly dependent on global economic activity data remaining strong, the U.S. Federal Reserve maintaining its dovish bent, and top commodity consumers such as China continuing to support commodity-laden activity.

Oil prices posted their strongest quarterly price gain in almost 10 years in Q1 2019. The S&P GSCI Petroleum ended the month up 2.9% and up 27.1% YTD. In mid-March, OPEC scrapped its planned April meeting, declaring that it would now delay any decision to extend production cuts until June, once the market had assessed the impact of U.S. sanctions on Iran and the crisis in Venezuela. However, it is clear that cracks in the OPEC Plus union are emerging. OPEC’s de facto leader Saudi Arabia favors cuts for the full year, while Russia, which joined the agreement reluctantly, is seen as less keen to restrict supply beyond September. While supply has been the main driver of the recent price appreciation, it is worth recalling that demand is what led to the sizable price decline in the final months of 2018. There are nascent signs that Asian demand has stabilized, but there are growing concerns regarding European demand.

Performance across the industrial metals complex was more disparate, leaving the S&P GSCI Industrial Metals flat for the month. The rise in commodities this year has been partly fueled by hopes for an agreement to end a trade war between the U.S. and China. Zinc and nickel were the standout beneficiaries of such growing expectations, and, combined with critically low inventory levels, this pushed the S&P GSCI Zinc and S&P GSCI Nickel up approximately 21% YTD. Aluminum is the laggard industrial metal YTD, and the S&P GSCI Aluminum was down 0.2% in March and up a relatively meek 3.4% YTD. Investor concerns regarding rising aluminum supplies have been heightened since the Russian aluminum giant Rusal resumed sales to the U.S. market, following its removal from the U.S. sanctions list.

A stronger U.S. dollar, growing expectations of a trade deal between the U.S. and China, and a general rise in investors’ risk appetite all contributed to gold posting its second consecutive down month in March (down 1.6% for the month and up only 0.9% YTD). These factors were more than sufficient to offset any support from the apparent end of interest rate increases in the U.S. Gold is traditionally seen as a safe place to invest during periods of uncertainty; higher interest rates hurt gold because they make bullion, which pays no yield, meaning it is less attractive to investors, while a stronger U.S. dollar can depress demand by making gold more expensive for buyers in other currencies.

As is often the case, the release of the USDA’s Prospective Plantings report on the last trading day of the first quarter accounted for the bulk of the excitement in the agricultural markets in March. The USDA pegged U.S. corn plantings 1.5 million acres higher than the market expected, and domestic corn inventory halfway through the 2018/2019 marketing year came in 270 million bushels heavier than predicted. The S&P GSCI Corn ended the month down 3.7%. The USDA placed March 1, 2019, soybean stocks at record levels, while soybean acres came in 1.55 million below the trade estimate, but the S&P GSCI Soybeans still ended the month down 2.7%. The only bright spot in the agricultural sector in March was cotton, with the S&P GSCI Cotton up 6.8% for the month and up 6.2% YTD, reflecting the USDA’s forecast for considerably lower cotton acres. Grain market participants will now turn their focus to the planting season and specifically the impact, if any, of recent flooding on planting progress and the final U.S. acreage mix.

The standout performer across the commodity complex in March was lean hogs, with the S&P GSCI Lean Hogs up 23.8% for the month and up 6.9% YTD, pushing the broader S&P GSCI Livestock up 5.5% in March and up 3.9% YTD. Lean hogs spent the first two months of the year in the doldrums fixated on higher-than-expected levels of U.S. pork production and ongoing market access restrictions for U.S. pork in key export markets. By March, these factors were dwarfed by the realization that the scope, severity, and impact of the African swine flu outbreak in China had potentially been greatly misunderstood.

The posts on this blog are opinions, not advice. Please read our Disclaimers.

Using the S&P/JPX Dividend Aristocrats® to Invest in Japanese Dividend Growers

Contributor Image
Izzy Wang

Senior Analyst, Factors and Dividends

S&P Dow Jones Indices

While some dividend-paying companies give out occasional and unsustainable dividends, dividend-growing companies—such as household names like Coca-Cola, Exxon Mobile, and AT&T in the U.S.—provide steadily increasing dividend payouts every year.

These long-standing dividend growers are called “Dividend Aristocrats,” and there are two reasons for it. First, with successful business operations and disciplined financial management, they are solid free-cash-flow generators and thus have a secured cash source to support their dividend policy for many years. Second, once a company promises increasing dividends, it has to live up to the market expectation.[1]

Japan’s economy features its own household names (known as Ote kigyo 大手企業, “big corporates,” or Yumei kigyo 有名企業, “famous corporates”). Many of them are the stars of the prosperous Keiretsu economy: names such as Sumitomo, Mitsui, and Mitsubishi. Others—such as energy suppliers and banks—started out regionally and expanded nationwide. Another younger group of big names gained a leading position with successful new business models and market popularity. For example, NTT DoCoMo, the predominant mobile operator, serves over 73 million customers in Japan and has a global presence in APAC, Europe, and America.

The S&P/JPX Dividend Aristocrats provides a transparent, rules-based way to track the Japanese Dividend Aristocrats,” a way to quantify the “Yumei kigyo.” This index includes Japanese companies that have increased and maintained dividends for at least 10 straight years. Its most recent constituents include popular brands such as Lawson Inc., Yahoo Japan, and NTT DoCoMo (see Exhibit 1). There are region-based companies: Osaka Gas, which serves 68 million households covering 3,220 square kilometers; Shizuoka Bank, which received the highest rating by Moody’s among all Japanese financial institutions; Okinawa Electric Power; and Fukuoka Financial Group. Keiretsu names are included as well: Mitsubishi UFJ Lease and Finance, Sumitomo Forestry Co, and Sony Financial Holdings.

Although the hurdle of dividend increases and maintenance for index inclusion is 10 years, most constituents have a longer history of paying out increasing dividends (see Exhibit 2). The four top-ranking companies (Topre Corp, Osaka Gas Co, Nippon Kayaku Co, and Takeda Pharmaceutical Co) have an impressive record of 33 straight years. The index average is 19 years and over 90% of constituents have paid increasing or stable dividends for more than 10 straight years.

To see the benefit of the Dividend Aristocrats investment, take Topre Corp. as an example of a typical scenario. If we invested JPY 10,000 into Topre Corp. 13 years ago, thanks to its increasing dividend policy (see Exhibit 3), we would have received a total of JPY 3,059 in dividends by the end of 2018, at a constant 2% return from the dividend income every year. This profit would be in addition to capital appreciation. By the end of 2018, our equity investment would more than double from JPY 10,000 to JPY 22,380 (see Exhibit 4), an impressive average annual price return of 4.4% despite the 2008 financial crisis and the 2018 meltdown in the Japanese market.

A broader picture with more constituent examples and with the S&P/JPX Dividend Aristocrats as a whole shows a similarly beneficial performance. Exhibit 5 shows the hypothetical returns for the top three constituents (by index weight) and for the index. As in the Topre Corp. example, we would invest JPY 10,000 for each stock or the index at the end of 2005 and hold it for 13 years. We saw excess returns for all cases when compared to the TOPIX during the period.

Exhibit 6 visualizes the performance of the S&P/JPX Dividend Aristocrats as measured by both total return (with dividends) and price return (without dividends) since index launch.

For investors who are worried about market volatility but wish to maintain equity exposure to generate income, the Dividend Aristocrats with their stable dividend growth may be attractive.

[1]   Refer to A Case for Dividend Growth Strategies.

The posts on this blog are opinions, not advice. Please read our Disclaimers.

S&P 500® Has Best First Quarter in over 20 Years – But Upward Momentum Slows

Contributor Image
Louis Bellucci

Senior Director, Index Governance

S&P Dow Jones Indices

The S&P 500 finished Q1 2019 up 13.07%. This was the best first quarter return since the 13.53% posted in Q1 1998. January’s 7.87% return was the best start to the year since 1987 (13.18%). The hot start cooled some with the 10th-best February since 1987, at 2.97%. In March, the upward momentum slowed further, posting a 1.79% return, making it the 15th-best March since 1987. Overall, 32 of the 42 segments of the U.S. equity market had lower consecutive returns from January to February and then February to March.

To begin the month, on March 1, the S&P 500 closed above 2,800 for the first time since Nov. 8, 2018. Throughout March, the S&P 500 challenged the 2,800 resistance level multiple times. It closed at 2,854.88 on March 21, which was the highest point since the index closed at 2,880.34 on Oct. 9, 2018. The S&P 500 hovered around 2,800 as the market awaited new developments in the U.S.-China trade talks and the Federal Reserve’s outlook dimmed. Fears of slowing growth also factored into decelerating the upward momentum.

As was the case in 2019, the S&P 500 posted positive returns during all three months of the first quarter on eight other occasions over the past 30 years, most recently at the start of 2013. April was also positive six of those eight times. In every year that the first three months were all positive, the S&P 500 not only ended the year positive, but also ended higher than the Q1 index level.

The S&P MidCap 400® (-0.74%) and S&P SmallCap 600® (-3.53%) were both negative for the month of March. Thirty-three of 42 segments of the U.S. equity market had lower returns in March than in February, but only 19 were negative. Nine of 11 large-cap sectors were positive, compared to 6 of 11 mid-cap and only 4 of 11 small-cap sectors. Information Technology was the best-performing large-cap sector, with a 4.75% return in March, but it was the seventh-best sector in both the mid- and small-cap segments. Financials was the worst-performing sector in all three size segments. Additionally, growth outperformed value for the third consecutive month.

The posts on this blog are opinions, not advice. Please read our Disclaimers.