After the hottest January in 30 years, the broad market rally continued with 38 of 42 segments of the U.S. equity market positive in February (as of Feb. 28, 2019.) After the Fed said it could take a break from rate hikes and it would be flexible with its balance sheet, and the market rallied, it was clear the Fed was a key driving force behind the December drop and January rally. Now the progression of the U.S.-China trade talks seem to be helping U.S. equities further, especially driven by sectors more exposed to international revenues, like technology, materials and industrials.
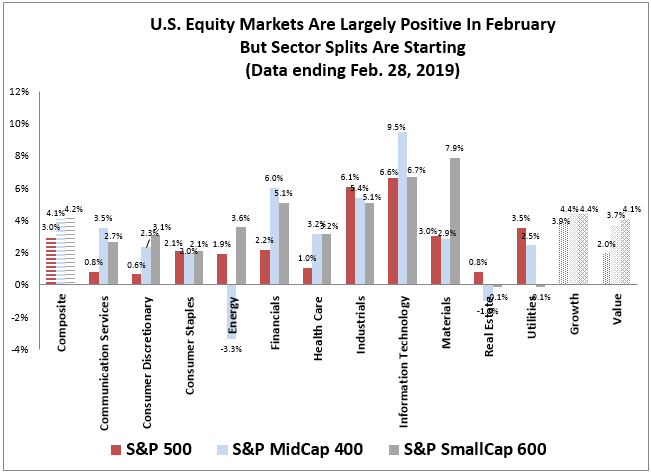
The S&P 500 return of 3.0% in February added to January’s gain of 7.9% gives the index a year-to-date gain of 11.1% to start 2019. That is the 5th biggest gain to start a year in all of the history of the S&P 500, and the best start since 1987 when the index gained 17.4% in its first two months. Other years with bigger gains in their first two months were 1975, 1943 and 1931 with respective returns of 19.0%, 12.3% and 16.9%.
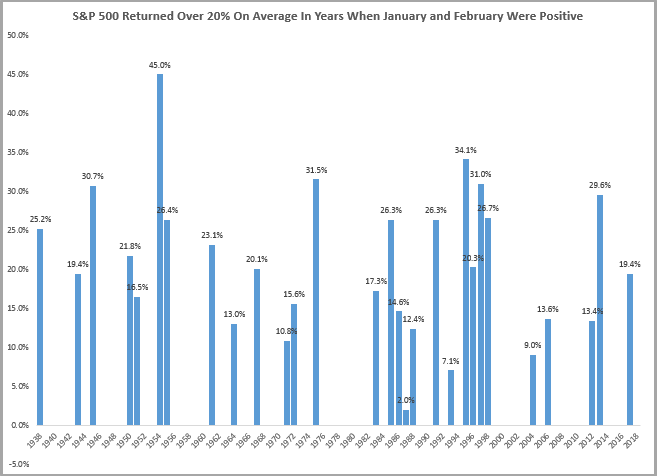
Historically, when January and February each gained, there has been a significantly positive year. Since 1938, when both January and February were positive, the year ended up on average more than 20%, and was positive 29 of 30 times – just slightly negative in 2011(-0.002%). In 26 of the 30 years, the gains were double digits, and in 15 of the 30 years, the returns were greater than 20%. It is also worth noting that prior to 1938, January and February were each positive in 1930, 1931, 1936 and 1937 with respective annual returns of -28.5%, -47.1%, 27.9% and -38.6%. Including these years, the average return in years gaining in each of the first two months was 15.1%.
While historically, the gains in years with positive Januaries and Februaries have been positive, it is unusual to see positive performance so broadly across segments, so there may be more divergence in performance depending on how international trade develops. Also, S&P 500 volatility is lower now, which can result from dropping correlations between sectors. On average through history, the annualized 30-day volatility for the S&P 500 is 15.3%, and in February dropped from 24.9% to 10.6%, which is the biggest volatility drop ever in any February, and biggest decline in a month since January 2009. It is also a volatility drop in magnitude that has only been observed seven months prior since December 1940 and including June 1948, August 1950, July 1962, December 1987, December 1997 and January 2009. The current 30-day annualized volatility is now the lowest since mid-October, despite ongoing uncertainty both domestically and abroad.
While the S&P 500 has had a historically strong start, both the S&P SmallCap 600 and S&P MidCap 400 outperformed with respective gains in February of 4.2% and 4.1% for year-to-date returns of 15.2% and 14.9%, respectively. Year-to-date the performance in mid-caps and small-caps has been record setting, but also, the gains have been the best ever for 20 of 42 segments. Both value and growth in the S&P 500, as well as value in the S&P SmallCap 600 and S&P MidCap 400 have had their best starts, and both real estate and industrials logged records across sizes.
Now, a split in the sector performance has started and may continue as trade negotiations create winners and losers. Industrials, information technology, materials, and health care may rally if trade tensions ease, and there may be more opportunity in mid-caps if the dollar falls. These sectors have most international revenues, and health care is especially sensitive to growth. If tensions rise, utilities, real estate and financials may perform since they have the highest percentage of revenues from the U.S., so are most insulated from trade issues. Also, small caps are most defensive to international economic slowdowns and to a rising dollar. Notice, already that real estate has started to fall, perhaps from the optimism over trade.
The posts on this blog are opinions, not advice. Please read our Disclaimers.