Get Indexology® Blog updates via email.

In This List

The Virtues of Slow and Steady

Leveraged Loan Market – Growing but Lower Protection?

October Outperformance for the S&P Risk Parity Indices

Stocks Rocked The House Post Midterm Elections

The World’s Largest Pension Fund Engages in Carbon Disclosure

The Virtues of Slow and Steady

Contributor Image
Fei Mei Chan

Former Director, Core Product Management

S&P Dow Jones Indices

For most of 2018, the S&P 500 Low Volatility Index® underperformed its parent S&P 500. Through the first nine months of 2018, the S&P 500 climbed 11% while the S&P 500 Low Volatility Index was up only 6%. Then October came and, in one month of acute volatility, the low volatility index recaptured parity with the benchmark. Both indices were up around 3% year to date through Oct. 31, 2018. (This reversal trend continued into November and the S&P 500 Low Volatility Index now has the lead.)

Volatility rose across all sectors of the S&P 500 (see Exhibit 1) and this gives us partial insight into the latest rebalance (reflecting data as of Oct. 31, 2018 and effective after market close Nov. 16, 2018) for the S&P 500 Low Volatility Index.

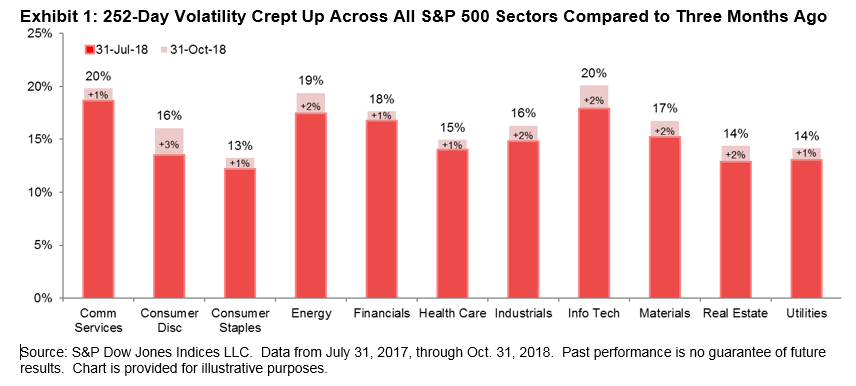
Exhibit 2 shows the sector allocations for the low volatility index after the most recent rebalance compared to three months prior. As a side note, the GICS reshuffle at the end of September 2018 resulted in a newly named Communication Services sector (combining the old Telecommunication Services sector with some companies shifted from Consumer Discretionary and Technology). However, as it relates to the S&P 500 Low Volatility Index, this change was mostly cosmetic. The index held no Telecom companies three months ago and this rebalance also yielded no stocks from the Communication Services.

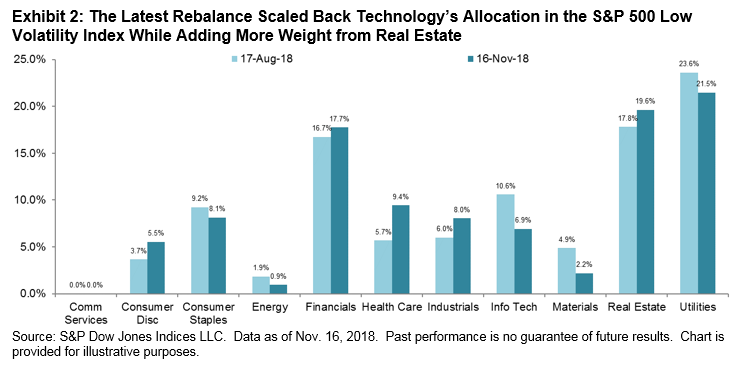
Outside of the GICS restructure, the most significant changes were in Health Care and Technology, an addition and a reduction of 4%, respectively. A few names dropped from the Technology sector but the sector’s current standing within the index is still fairly significant from a historical context. Real Estate continued to gain ground, now almost on par with Utilities’ weight in the index. It is the second consecutive rebalance where Utilities scaled back; the sector now has a 21% allocation. Consumer Discretionary’s addition of 2% was somewhat counterintuitive, as the sector was among those that rose the most in volatility, pointing to specific stocks with lower relative volatility in this sector.


The posts on this blog are opinions, not advice. Please read our Disclaimers.

Leveraged Loan Market – Growing but Lower Protection?

Contributor Image
Hong Xie

Former Senior Director, Global Research & Design

S&P Dow Jones Indices

In a prior blog,[1] we highlighted the return profile and yield of the S&P/LSTA U.S. Leveraged Loan 100 Index. We showed that carry is the dominant driver of returns. In this follow-up post, we review additional characteristics of the senior loan market and its evolution in recent years.

The leveraged loan deal size has increased significantly on average during the past six years. Exhibit 1 shows the total and median outstanding size of the 100 loans in the index. From March 2007 to September 2018, the median size of the loans almost doubled, from USD 1.5 billion to USD 2.8 billion. Since the index includes only the 100 largest loan facilities, the total loan size represented by the index increased consistently with the steady growth of the individual loan size, from USD 171 billion to USD 302 billion over the same period.

With the rapid growth of the loan market, an increasing number of loans are issued with fewer restrictions and protective covenants for the benefit of the lender. We demonstrate this in Exhibit 2, which shows that the percentage of covenant-light loans in the index grew from 31% in June 2012 to 79% in September 2018.

Over the past few years, the loan market has seen extensive refinancing at lower spread due to strong demand from investors. Exhibit 3 shows the comparison of the original LIBOR spread and the current LIBOR spread for the index from October 2012 to September 2018. Until the end of 2015, these two spread series followed each other closely, reflecting limited refinancing activities in the loan market. In the first half of 2016, refinancing picked up speed and quickly resulted in lower current spread than original spread. However, from the second half of 2016 to September 2018, the gap between current and original spread steadily closed.

Lastly, we review the industry allocation of the S&P/LSTA U.S. Leveraged Loan 100 Index over time. Exhibit 4 shows the historical industry composition of the index at the end of each year since 2007. As of September 2018, the Services/Retail industries is the largest, accounting for 21% of the index, followed by Computers & Electronics at 18%.

During recent years, leveraged loans have been one of the most popular fixed income segments, given their relatively higher yield and little duration risk. With strong demand from market participants, the leveraged loan market itself is experiencing significant growth in size and is undergoing changes in deal structure. Our analysis shows that among the larger loans, as represented by the S&P/LSTA Leveraged Loan 100 Index, more loans lack protective covenants for lenders. In addition, while loan refinancing was widespread in 2016, which caused a gap between original and current spread, that gap has diminished since then.

[1] https://www.indexologyblog.com/2018/10/24/leveraged-loans-in-a-rising-rate-environment-carry-factor-dominates/

The posts on this blog are opinions, not advice. Please read our Disclaimers.

October Outperformance for the S&P Risk Parity Indices

Contributor Image
Rupert Watts

Head of Factors and Dividends

S&P Dow Jones Indices

Traditionally known for spooky ghosts and witches, October was also a scary month for investors. In spite of an end-of-month rally, global stocks recorded their worst monthly loss since 2011, wiping out USD 5 trillion of investor value. Furthermore, investors were spooked by a rare simultaneous drop in bond prices. In short, this was not a great month for diversification.

While equities and bonds have historically had a low correlation, the diversification benefit has not been maximized by asset-weighted portfolios such as the traditional 60/40 allocation. The influence of bonds is often drowned out by their more volatile equity counterpart. Of course, this was painfully witnessed firsthand during the 2008 global financial crisis, as portfolios dominated by equities suffered large drawdowns.

One of the silver linings of the financial crisis was that it triggered a shift in the way the asset owner community thinks about risk. Increasingly, investors have begun to view asset allocation through a risk-based lens and to embrace the idea of viewing individual assets in a total portfolio context. This philosophy is at the heart of a class of investment strategies known as risk parity.

Risk parity allocates capital across asset classes so that each asset class contributes an equal amount of volatility to the total volatility of the portfolio. It typically assigns higher weights to lower-returning asset classes, such as bonds. The goal of risk parity is to maximize the diversification benefits across complementary asset classes in order to provide a smoother return profile and minimize losses from another major downturn. In the aftermath of that crisis, risk parity has gained significant traction within the asset owner community, growing to an estimated USD 150 billion to USD 175 billion at year-end 2017, according to the International Monetary Fund.[1]

Surprisingly, there was no clear, relevant benchmark to serve this large, established asset base. Upon identifying this need, we launched the S&P Risk Parity Indices with the goal of providing a better way to measure the efficacy of existing risk parity funds. Despite only having been launched in July 2018, our risk parity index suite is already generating a significant amount of interest across the asset owner and consulting channels.

Although it is never wise to judge a long-term strategy by such a narrow time frame, I was excited to appraise October’s performance, given that it was the first significant market “blip” since our index series was launched.

The good news is that each volatility target in the suite outperformed the global 60/40 portfolio, posting modest losses compared with the large drawdowns witnessed in equity markets (see Exhibits 2 and 3). Of course, much of this outperformance was due to relatively lower allocation to equities, accounting for less than 20% of the allocation weight. However, assuming historical low correlations persist, risk-balanced portfolios such as this will likely continue to outperform during pullbacks.

These promising results make me excited to conduct my next analysis to see how the S&P Risk Parity Indices performed relative to their active counterparts. Stay tuned!

[1] https://www.imf.org/~/media/Files/Publications/GFSR/2017/October/Chapter-1/pdf-data/figure1-21.ashx

The posts on this blog are opinions, not advice. Please read our Disclaimers.

Stocks Rocked The House Post Midterm Elections

Contributor Image
Jodie Gunzberg

Former Managing Director, Head of U.S. Equities

S&P Dow Jones Indices

After the S&P 500 logged its 9th worst Oct. on record, losing 6.9%, it has bounced back 2.6% month-to-date through Nov. 9, 2018.  Though the monthly returns for the eight Novembers following the historically bad Octobers were only positive twice – in 1978 (President Jimmy Carter midterm year) and 1933 – the fact there was a midterm election this year may help the chance of a solid rally if history repeats itself.  Historically, the S&P 500 has been positive in most periods after the midterm elections.

In the months of Nov. and Dec. during historical midterm election years, the S&P 500 gained 14 of 22 times in Nov. and in 15 of 22 times in Dec. with a combined 2-month gain in 17 of the 22 midterm election year-ends.  In percentage terms, the S&P 500 gained in 64% of midterm election Nov. months and 68% of the following month that when combined into a 2-month return resulted in gains 77% of the time.  Also, the magnitude of the average gains in the 2-month period was 6.1%, more than the magnitude of the average loss of 4.1%.

In longer time periods, over 6-, 12-, and 24-months post historical midterm election years, the S&P 500 fell just 3 times in the 6-month and 24-month periods and only twice in the 12-month periods.  The two negative 12-month periods followed the midterm elections in 1930 (President Herbert Hoover) and 1938 (President Franklin D. Roosevelt) with respective losses of 37.8% and 2.6%.  Interestingly, President Herbert Hoover was also Republican with a split Congress post midterm election in 1930.  (President Ronald Reagan in 1982 was the only other Republican with a split Congress post midterm election besides President William Taft in 1910, before the S&P 500 was calculated.)   Since the midterm election of 1942, there have been 19 consecutively positive 12-month post midterm election period gains.  In the shorter and longer post midterm election periods of 6- and 24-months, two of the three losses were also in 1930 and 1938.  In the 6-month period after the midterm elections in 1930 and 1938, the S&P 500 lost a respective 10.9% and 17.1%.  The additional 6-month post midterm election loss of 1.8% happened in 1946 (President Harry S. Truman).  Finally, the three losing 24-month periods following the midterm elections were in 1930, 1938 and 2008 (President Barack Obama) with respective losses of 58.9%, 15.9% and 29.7%.

Source: S&P Dow Jones Indices.

When expanding this analysis across sizes, sectors and styles, the data is more limited by its history back to 1990 so only covers seven prior midterm elections during the presidential terms of George H. W. Bush (Republican, 1990,) Bill Clinton (Democrat, 1994, 1998,) George W. Bush (Republican, 2002, 2006,) and Barack Obama (Democrat, 2010, 2014.)  As noted, there were 4 Democrat and 3 Republican terms.  Five of the seven had a united Congress that was opposite the presidential party, the 2002 period was completely Republican, and the 2010 period under President Obama had a Republican House and Democrat Senate after the midterm election.

Irrespective of parties, all U.S. equities have done well in post midterm election periods.  On average, in the 12-months following midterm elections every size, sector and style of the U.S. equity market was positive.  Large caps performed best, gaining on average 16.6%, but the S&P MidCap 400 and S&P SmallCap 600 gained also a respective 15.4% and 14.1%.  Information technology was the best performing sector gaining on average, 32.5%, 43.3% and 29.1%, respectively, in large-, mid- and small-caps. Also, noteworthy is the outperformance of large- over small-caps in financials and materials on average in the 12-months post midterm elections, which is interesting given the interest rate sensitivity of financials and the influence of international trade on materials. Lastly, growth has outperformed value, and more significantly in mid- and small-caps than in large caps with average 12-month post midterm election returns of 17.2%, 20.9% and 17.0%, respectively in large-, mid- and small-cap growth, that were greater than the gains of 11.7%, 9.0% and 8.9% in value from large-, mid- and small-caps, respectively.

Source: S&P Dow Jones Indices. All data is price return. The S&P 500 and its sector data are from 1990, except real estate data are from 2002. The S&P 500 style data are from 1994. The S&P MidCap 400 and S&P Small Cap 600 are from 1994. The S&P MidCap 400 and S&P SmallCap 600 style and sector data are from 1998, except real estate data are from 2002.  Communication services was recently expanded from telecommunication services in Sep. 2018.

The only exceptions to the strong U.S. equity performance in the post midterm election periods came from energy in the mid- and small-caps during the months of Nov. and Dec., which is not surprising given the seasonality that pushes oil prices down in the the fourth quarter from reduced gasoline demand and refinery maintenance post the driving season.  Nov. is the worst month on average in the S&P GSCI Crude Oil index with losses of 2.9% since 1987.  However, since the large companies typically hedge against falling oil prices, they are more insulated from the oil price drops.

Not only have U.S. equities performed well on average in post midterm election periods, but now, with the split Congress, the potential gridlock on legislation may possibly benefit international stocks too.  If growth slows and inflation is weaker – pressured by falling oil, it is possible the Fed may moderate interest rate hikes that in-turn could limit the US dollar rise.  Also, if the trading tensions between China and US could ease, that might be helpful for the global markets.

The posts on this blog are opinions, not advice. Please read our Disclaimers.

The World’s Largest Pension Fund Engages in Carbon Disclosure

Contributor Image
Reid Steadman

Former Managing Director, Global Head of ESG & Innovation

S&P Dow Jones Indices

This blog post was co-authored with Dr Richard Mattison, Chief Executive Officer, Trucost, part of S&P Global

On Sept. 25, 2018, Japan’s Government Pension Investment Fund (GPIF)—the world’s largest pension fund—announced its selection of two new low-carbon indices, the S&P/JPX Carbon Efficient Index and the S&P Global Ex-Japan LargeMid Carbon Efficient Index, with an allocation of JPY 1.2 trillion (approximately USD 10.6 billion).[1]

GPIF President Norihiro Takahashi commented, “GPIF hopes that the selected Global Environmental Stock indices will provide an opportunity for companies to work on carbon efficiency and disclosure… Moreover, the indices can include small listed companies that were not covered by other ESG indices, which goes along with GPIF’s idea to improve the sustainability of the overall market… GPIF will continue to actively engage in ESG investment so as to maintain pension reserves for the future generations.”[2]

The broad market approach taken by GPIF presents an interesting case study. The question is, can a traditional passive investment approach help with the transition to a low-carbon economy?

Early indications are positive. Since the launch of these indices, Trucost, part of S&P Global and carbon data provider for the S&P Carbon Efficient Index Series, has seen a 700% uplift in the number of enquiries from companies wanting to understand how their carbon performance is assessed—and how they can improve their performance in the future.

While GPIF’s investment in carbon-efficient indices may be described as passive in style, the team is taking an active approach to market engagement. Just this week, a full capacity audience of 500 companies and investors attended Nikkei’s “Sustainable Development Goals Forum” in Tokyo. GPIF’s president joined the Governor of the Bank of England Mark Carney and Trucost CEO Richard Mattison on stage to outline the importance of the transition to a low-carbon economy. S&P Dow Jones Indices and Trucost highlighted the key components of the S&P Carbon Efficient Index Series.

Governor Carney emphasized the importance of the recommendations from the Taskforce on Climate-related Financial Disclosures (TCFD) and encouraged all companies and investors to assess the resilience of their strategy to different climate transition pathways, using scenario analysis techniques. Many companies at the event described how difficult it was to perform this type of scenario analysis, and Richard Mattison highlighted how new Trucost datasets on carbon price risk will help companies and investors understand how the profitability of their assets will be affected, out to 2030, under a 2 degrees Celsius climate scenario. S&P Dow Jones Indices has also applied this data to create the S&P Carbon Price Risk Adjusted Index Series.

Companies in the Asia Pacific region have traditionally lagged their European and Americas counterparts on carbon reporting, although Japan is already demonstrating significant leadership in the region (Exhibit 1). Of course, in just one month, it is too soon to fully assess the impact of GPIF’s commitment to carbon, but the early signs are promising, and we’ll be paying close attention to the numbers in order to report back on this interesting case study. This engagement with the market by the world’s largest pension fund could lead to significant improvement in disclosure, more efficient markets, and over time, significant carbon emission reductions.

Since the launch of the S&P/JPX Carbon Efficient Index and the S&P Global Ex-Japan LargeMid Carbon Efficient Index, the S&P Global 1200 Carbon Efficient Index, S&P 500® Carbon Efficient Index, and S&P Europe 350 Carbon Efficient Index have been added to the S&P Carbon Efficient Index Series. These indices are now available to all investors.


[1] https://www.gpif.go.jp/en/topics/GPIF%20Selected%20Global%20Environmental%20Stock%20Indices.pdf

[2] https://www.gpif.go.jp/en/topics/GPIF%20Selected%20Global%20Environmental%20Stock%20Indices.pdf

The posts on this blog are opinions, not advice. Please read our Disclaimers.