In a prior blog,[1] we highlighted the return profile and yield of the S&P/LSTA U.S. Leveraged Loan 100 Index. We showed that carry is the dominant driver of returns. In this follow-up post, we review additional characteristics of the senior loan market and its evolution in recent years.
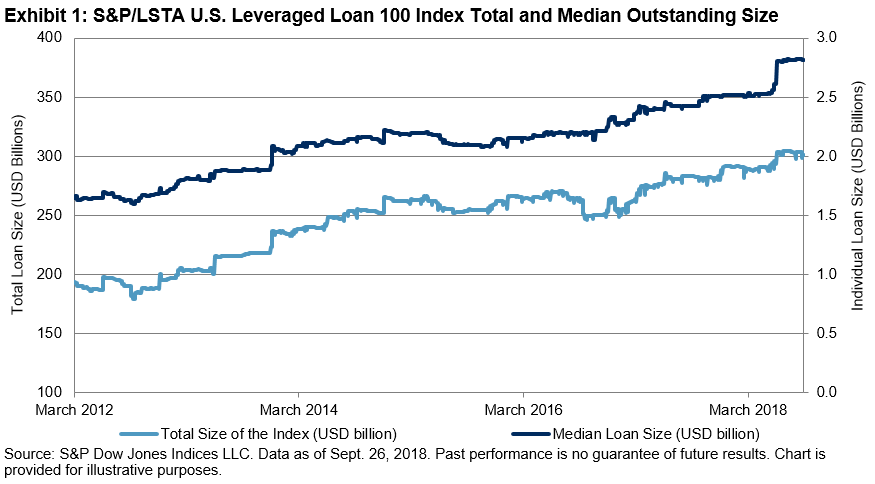
The leveraged loan deal size has increased significantly on average during the past six years. Exhibit 1 shows the total and median outstanding size of the 100 loans in the index. From March 2007 to September 2018, the median size of the loans almost doubled, from USD 1.5 billion to USD 2.8 billion. Since the index includes only the 100 largest loan facilities, the total loan size represented by the index increased consistently with the steady growth of the individual loan size, from USD 171 billion to USD 302 billion over the same period.
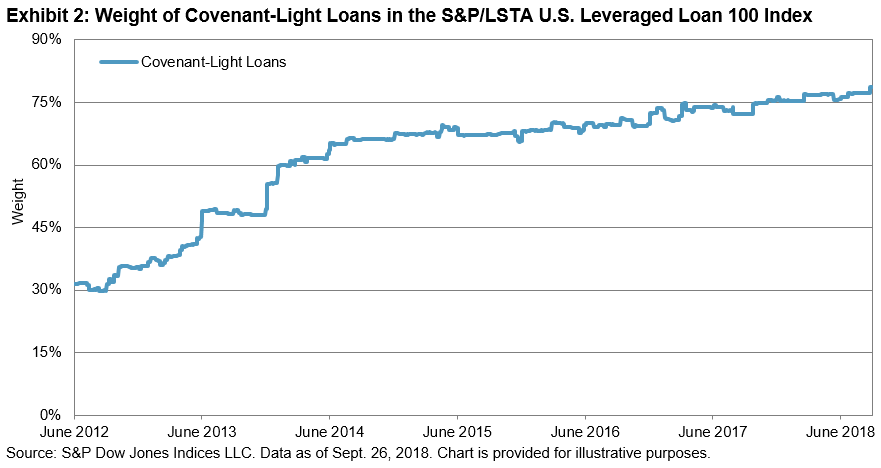
With the rapid growth of the loan market, an increasing number of loans are issued with fewer restrictions and protective covenants for the benefit of the lender. We demonstrate this in Exhibit 2, which shows that the percentage of covenant-light loans in the index grew from 31% in June 2012 to 79% in September 2018.
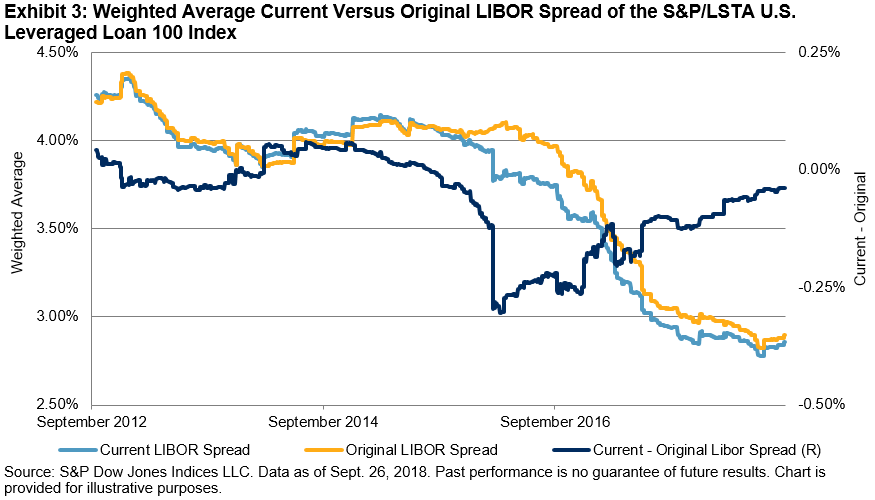
Over the past few years, the loan market has seen extensive refinancing at lower spread due to strong demand from investors. Exhibit 3 shows the comparison of the original LIBOR spread and the current LIBOR spread for the index from October 2012 to September 2018. Until the end of 2015, these two spread series followed each other closely, reflecting limited refinancing activities in the loan market. In the first half of 2016, refinancing picked up speed and quickly resulted in lower current spread than original spread. However, from the second half of 2016 to September 2018, the gap between current and original spread steadily closed.
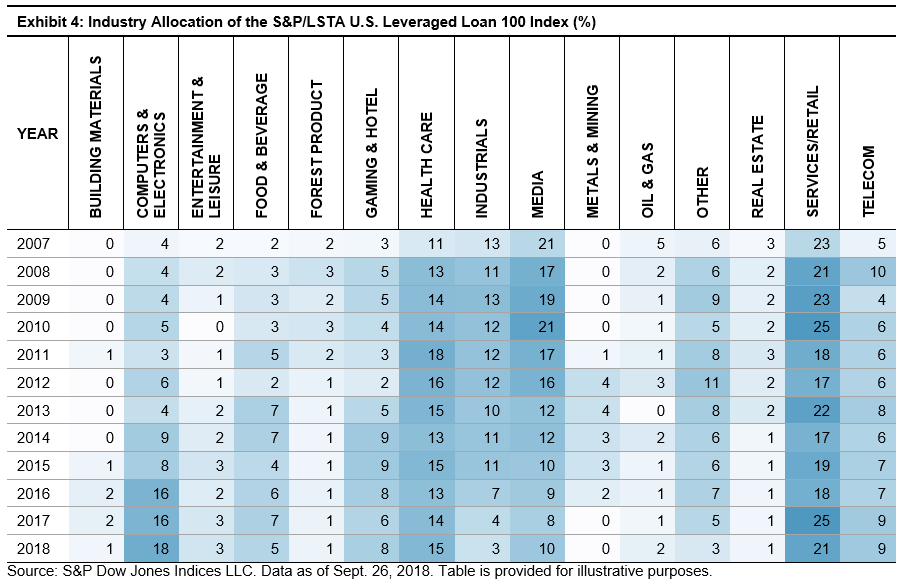
Lastly, we review the industry allocation of the S&P/LSTA U.S. Leveraged Loan 100 Index over time. Exhibit 4 shows the historical industry composition of the index at the end of each year since 2007. As of September 2018, the Services/Retail industries is the largest, accounting for 21% of the index, followed by Computers & Electronics at 18%.
During recent years, leveraged loans have been one of the most popular fixed income segments, given their relatively higher yield and little duration risk. With strong demand from market participants, the leveraged loan market itself is experiencing significant growth in size and is undergoing changes in deal structure. Our analysis shows that among the larger loans, as represented by the S&P/LSTA Leveraged Loan 100 Index, more loans lack protective covenants for lenders. In addition, while loan refinancing was widespread in 2016, which caused a gap between original and current spread, that gap has diminished since then.
[1] https://www.indexologyblog.com/2018/10/24/leveraged-loans-in-a-rising-rate-environment-carry-factor-dominates/
The posts on this blog are opinions, not advice. Please read our Disclaimers.