


Traditionally known for spooky ghosts and witches, October was also a scary month for investors. In spite of an end-of-month rally, global stocks recorded their worst monthly loss since 2011, wiping out USD 5 trillion of investor value. Furthermore, investors were spooked by a rare simultaneous drop in bond prices. In short, this was not a great month for diversification.
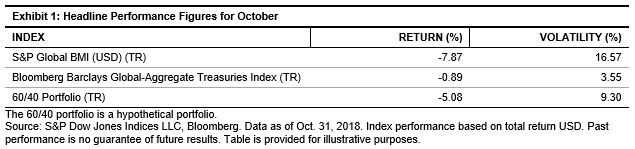
While equities and bonds have historically had a low correlation, the diversification benefit has not been maximized by asset-weighted portfolios such as the traditional 60/40 allocation. The influence of bonds is often drowned out by their more volatile equity counterpart. Of course, this was painfully witnessed firsthand during the 2008 global financial crisis, as portfolios dominated by equities suffered large drawdowns.
One of the silver linings of the financial crisis was that it triggered a shift in the way the asset owner community thinks about risk. Increasingly, investors have begun to view asset allocation through a risk-based lens and to embrace the idea of viewing individual assets in a total portfolio context. This philosophy is at the heart of a class of investment strategies known as risk parity.
Risk parity allocates capital across asset classes so that each asset class contributes an equal amount of volatility to the total volatility of the portfolio. It typically assigns higher weights to lower-returning asset classes, such as bonds. The goal of risk parity is to maximize the diversification benefits across complementary asset classes in order to provide a smoother return profile and minimize losses from another major downturn. In the aftermath of that crisis, risk parity has gained significant traction within the asset owner community, growing to an estimated USD 150 billion to USD 175 billion at year-end 2017, according to the International Monetary Fund.[1]
Surprisingly, there was no clear, relevant benchmark to serve this large, established asset base. Upon identifying this need, we launched the S&P Risk Parity Indices with the goal of providing a better way to measure the efficacy of existing risk parity funds. Despite only having been launched in July 2018, our risk parity index suite is already generating a significant amount of interest across the asset owner and consulting channels.
Although it is never wise to judge a long-term strategy by such a narrow time frame, I was excited to appraise October’s performance, given that it was the first significant market “blip” since our index series was launched.
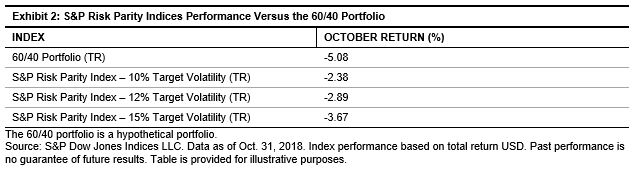
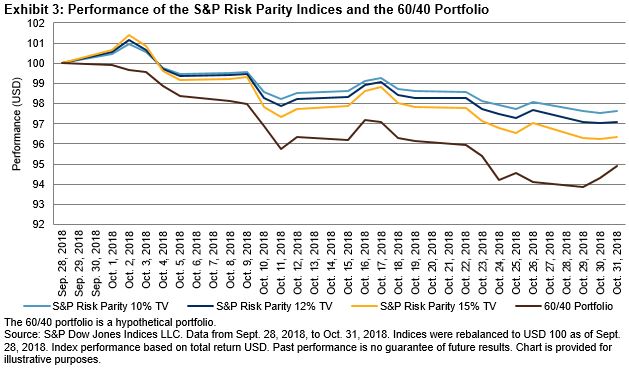
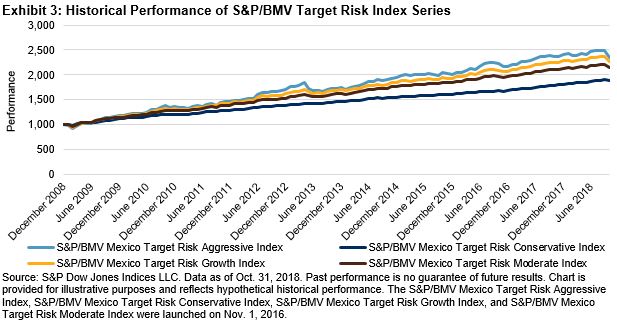
The good news is that each volatility target in the suite outperformed the global 60/40 portfolio, posting modest losses compared with the large drawdowns witnessed in equity markets (see Exhibits 2 and 3). Of course, much of this outperformance was due to relatively lower allocation to equities, accounting for less than 20% of the allocation weight. However, assuming historical low correlations persist, risk-balanced portfolios such as this will likely continue to outperform during pullbacks.
These promising results make me excited to conduct my next analysis to see how the S&P Risk Parity Indices performed relative to their active counterparts. Stay tuned!
[1] https://www.imf.org/~/media/Files/Publications/GFSR/2017/October/Chapter-1/pdf-data/figure1-21.ashx
The posts on this blog are opinions, not advice. Please read our Disclaimers.


 Source: