Get Indexology® Blog updates via email.

In This List

“Counter-cyclical” adjustment factor resumed to anchor Chinese currency

Relative Performance Impacts From the Introduction of Communication Services

Getting to Know the S&P BSE 500

The S&P Risk Parity Indices: Risk Contribution Versus Capital Allocation

Juxtaposition and Paradox

“Counter-cyclical” adjustment factor resumed to anchor Chinese currency

Contributor Image
Jack Jiang

Senior ETF Specialist, Index and Quantitative Investment

ICBC Credit Suisse Asset Management (International) Co., Ltd.

China resumed CNY fixing “counter-cyclical” adjustment factor

The People’s Bank of China (PBOC) announced on August 24 that China’s CNY fixing reporting banks have resumed the counter-cyclical adjustment (CCA) factor in the CNY official midpoint this month. This is the second move of Chinese authorities after the adoption of a 20% reserve requirement of FX forward positions on August 3. According to the PBOC, the moves are aimed at mitigating the RMB depreciation pressure arising from the procyclical sentiment caused by the strong USD and ongoing trade frictions.

 What is the counter-cyclical factor?

The counter-cyclical adjustment (CCA) factor was first introduced in May 2017 as a third factor on top of the basket of trade-weighted currency indices and closing spot level at 4:30 pm of the previous trading day when settling the official midpoint. The intention of this additional factor was to ward off the one-way bets on the yuan and the subsequent capital outflows.

The first introduction of the CCA in May 2017, when the yuan was also weak at around 6.9 against the U.S. dollar, stemmed the depreciation trend and was followed by sustained strengthening in the yuan against a basket of currencies. The S&P China 500 turned upward as well (see Figure 1). This factor was suspended in January 2018 as the depreciation pressures dissipated.

A signal to support the yuan

The announcement was seen as a signal from the PBOC that it is not comfortable with further depreciation in the yuan, as it could trigger capital outflows.

The yuan hovered at a 2.5 week high against the U.S. dollar on Monday, arresting the slump from the middle of June that has rattled global markets. (The S&P China 500 followed the trend again as indicated in Figure 1).

Some market players go with the hypothesis of a “7-3” threshold for stability—that is, not breaching 7 (or around 6.9) for the U.S. dollar vs. the yuan and FX reserves not falling below USD 3 trillion for Chinese regulators.

Nevertheless, in the long term, the currency rate of the world’s second-largest economy will rest with the expected return and risk premium on the investment.

Xinhuanet, http://www.xinhuanet.com/2018-08/28/c_1123338472.htm

DISCLAIMERS
This communication is confidential, is for informational purposes and is only for the intended recipients. It is not intended as an offer, investment advice or solicitation for the purchase or sale of any financial instrument or as an official confirmation of any transaction.  Some of the information contained herein including any expression of opinion, forecast, market prices or data has been obtained from or is based on sources believed by us to be reliable as at the date it is made, are subject to change without notice but is not guaranteed.  ICBC Credit Suisse, its subsidiaries and affiliates (collectively, “ICBCCS”) do not warrant nor do ICBCCS accept liability as to adequacy, accuracy, reliability or completeness of such information.
This transmission may contain information that is proprietary, privileged, confidential, and/or exempt from disclosure under applicable law. If you are not the intended recipient, you are hereby notified that any disclosure, copying, distribution, or use of the information contained herein (including any reliance thereon) is STRICTLY PROHIBITED. If you received this transmission in error, please immediately contact the sender and destroy the material in its entirety, whether in electronic or hard copy format. Although this transmission and any attachments are believed to be free of any virus or other defect that might affect any computer system into which it is received and opened, it is the responsibility of the recipient to ensure that it is virus free and no responsibility is accepted by ICBCCS for any loss or damage arising in any way from its use. Please note that any electronic communication that is conducted within or through ICBCCS’s systems is subject to interception, monitoring, review, retention and external production; may be stored or otherwise processed in countries other than the country in which you are located; and will be treated in accordance with ICBCCS’s policies and applicable laws and regulations.

The posts on this blog are opinions, not advice. Please read our Disclaimers.

Relative Performance Impacts From the Introduction of Communication Services

Contributor Image
Philip Murphy

Former Managing Director, Global Head of Index Governance

S&P Dow Jones Indices

S&P Dow Jones Indices will reshuffle stocks in September to reflect the revised structure of the Global Industry Classification Standard (GICS®) in its indices. The move will see telecommunication services replaced by a new sector called communication services. Its constituents will transfer from telecommunication, information technology (IT), and consumer discretionary.

Exhibit 1 shows affected S&P 500® sector weights as of July 10, 2018. Pro forma sector weights represent the index on July 10, 2018, as if communication services was in effect at that time. After September 2018, S&P 500 sectors should be more evenly distributed by index weight than they now are. Pro forma IT would lose almost 6% of its index weight, consumer discretionary almost 3%, and communication services would gain the difference.

The performance of headline cap-weighted benchmarks like the S&P 500 will not be affected by the GICS change. However, changes will occur in performance of affected sectors, stock contribution to sector returns, sector contribution to benchmark returns, and traditional performance attribution. In turn, assessments of active managers’ value creation/destruction may be affected.

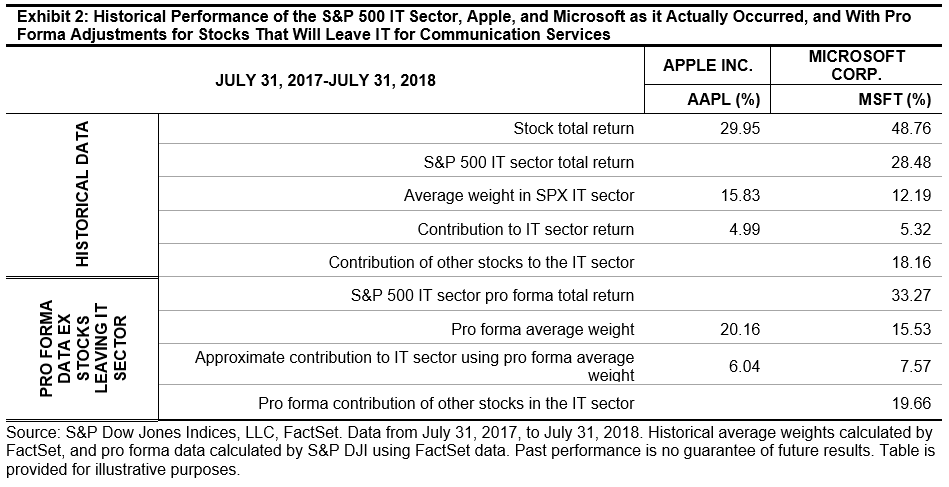
To show a hypothetical impact of the GICS change on stock contributions to sector returns, Exhibit 2 provides data from the S&P 500 Information Technology sector for the one-year period from July 31, 2017 through July 31, 2018. Including reinvestment of dividends, the S&P 500 IT Sector returned 28.48%, Apple (AAPL) stock returned 29.95%, and Microsoft (MSFT) returned 48.76%.

What are the mechanics behind pro forma changes in sector performance and stock contributions? With the departure of names like Alphabet (GOOG; GOOGL), Facebook (FB), and others, the IT sector will lose weight in the S&P 500. However, within the IT sector remaining stocks will be up-weighted to compensate for those departures. All else equal, returns of large stocks like Apple (AAPL) and Microsoft (MSFT) will therefore have even more impact on sector performance. On a pro forma basis, Apple’s and Microsoft’s strong returns for the one-year period ending July 2018 would have combined with their larger weights within IT to help pull up the overall return of the sector to 33.27%—an even higher bar for active technology stock pickers! Of course, circumstances in every period are different and the opposite could have been true.

Structural updates to GICS, such as the addition of the real estate sector several years ago, and the upcoming shift to communication services, are evidence that GICS is a dynamic framework seeking to reflect economic evidence and trends. Stakeholders utilizing sector-based performance contribution and/or attribution analysis should be aware of these changes and the potential effects they can have on their analyses.

The posts on this blog are opinions, not advice. Please read our Disclaimers.

Getting to Know the S&P BSE 500

Contributor Image
Mahavir Kaswa

Former Associate Director, Product Management

S&P BSE Indices

Over the past three to four decades, the Indian equity market has witnessed significant growth, on account of increasing foreign capital flows and participation by domestic institutional investors. The expanding depth and breadth has brought a stronger demand from market participants for suitable benchmarks. The S&P BSE SENSEX launched in 1986 and was the first and most popular Indian benchmark, followed by the S&P BSE 100 and S&P BSE 200 in 1989 and 1994, respectively. In 1999, the S&P BSE 500 was launched in response to market demand for broader benchmarks that offer more complete coverage of the Indian equity market.

The S&P BSE 500 is designed to be a broad representation of the Indian equity market, consisting of the 500 leading companies in terms of total market capitalization that are members of the S&P BSE AllCap. The differential voting rights shares class is eligible to be part of the index, which means that at any point in time, the index will include a fixed number of 500 companies, but the number of stocks in the index could be greater than or equal to 500. The index constituents and sectors are weighted in proportion to their float market capitalization. The index is reviewed semiannually in June and December.

In a recently published paper titled “Measuring Indian Equities: The S&P BSE 500,” we saw that as of April 30, 2018, the S&P BSE 500 represented approximately 88% of all BSE-listed companies, with a total market capitalization of INR 1,35,14,943 crores (approximately USD 2 trillion).

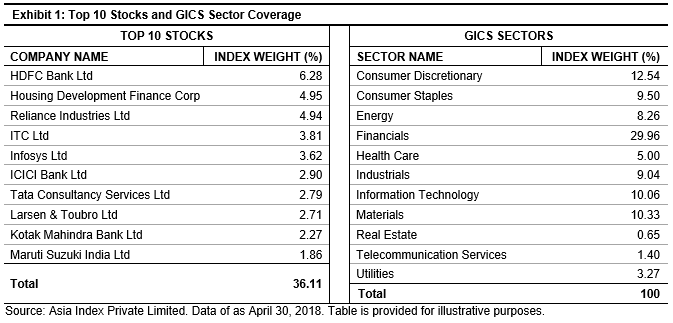
The S&P BSE 500 is diversified across sectors, and no individual sector had an excessive overweight in the index in the period studied. As shown in Exhibit 1, the financials sector had the highest weight in the index, with 30%, followed by consumer discretionary at 12.5%. The services sectors, which include financials, information technology, and telecommunications services, contributed nearly 41% to the total index weight. Also, the combined weight of constituents that have individual derivative contracts was 87%, which facilitates risk management of the index.

Similarly, the S&P BSE 500 offers exposure to all size segments. Large-cap stocks accounted for 79% of the total index weight, mid caps 13%, and small caps 8% as of April 30, 2018 (see Exhibit 2).

With coverage of more than 88% of India’s listed equity universe and diversified exposure to all sizes and all key economic sectors of India’s economy, the S&P BSE 500 seeks to provide comprehensive coverage of the Indian equity market.

The posts on this blog are opinions, not advice. Please read our Disclaimers.

The S&P Risk Parity Indices: Risk Contribution Versus Capital Allocation

Contributor Image
Berlinda Liu

Former Director, Multi-Asset Indices

S&P Dow Jones Indices

In a prior blog, we showed that the S&P Risk Parity Indices tracked the average performance of active risk parity funds closer than a traditional 60/40 equity/bond portfolio. In this second part of the blog series, we will examine the risk contribution and capital allocation of these indices.

The principles behind risk parity strategies relate to answering a deceptively straightforward question: What is diversification? Traditionally, investors have allocated their capital across multiple asset classes to achieve diversification, such as the 60/40 equity/bond blend. A previous blog by Phillip Brzenk showed that such an approach led to a disproportionate allocation of risk across asset classes, with equities occupying almost all of the portfolio risk. A risk parity strategy, on the other hand, aims for balanced risk contribution from all asset classes. A proper risk parity benchmark should demonstrate roughly equal risk contribution from all asset classes.

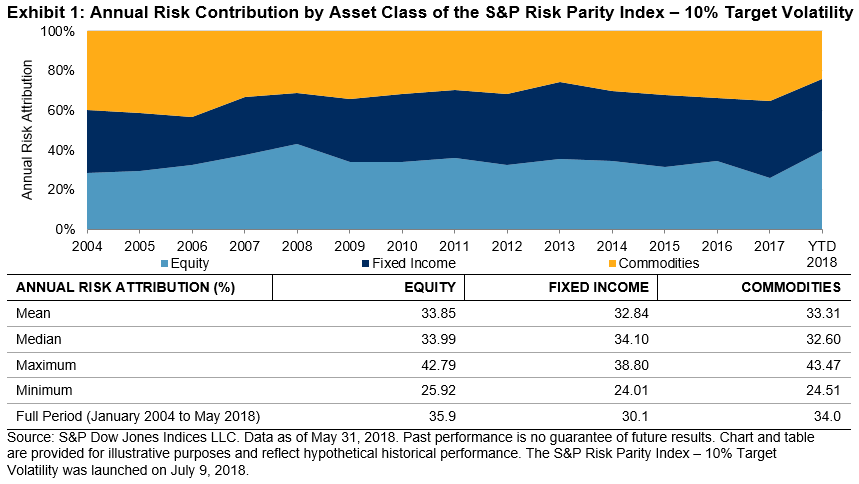
Exhibit 1 shows the back-tested historical risk contribution of the S&P Risk Parity Index – 10% Target Volatility. Over the past 14 years, equities, fixed income, and commodities have contributed roughly the same amount of volatility to the portfolio, despite some fluctuations over time. We can see that the risk contribution of the different asset classes varies based on different market environments. This is not surprising, as we use realized volatilities as the risk measure in the index methodology. For example, in 2008, when the equity market was experiencing a bear market, the risk contribution by equities reached an all-time high of 42.79%. After the volatility seen in 2008 was included in the realized volatility calculation, equity risk contribution subsided to 33.99% in 2009, close to the one-third risk attribution expected in a risk parity portfolio. Despite fluctuations in annual risk attributions, the three asset classes contributed almost equally to the portfolio volatilities over time, either measured as mean or median (see Exhibit 1).

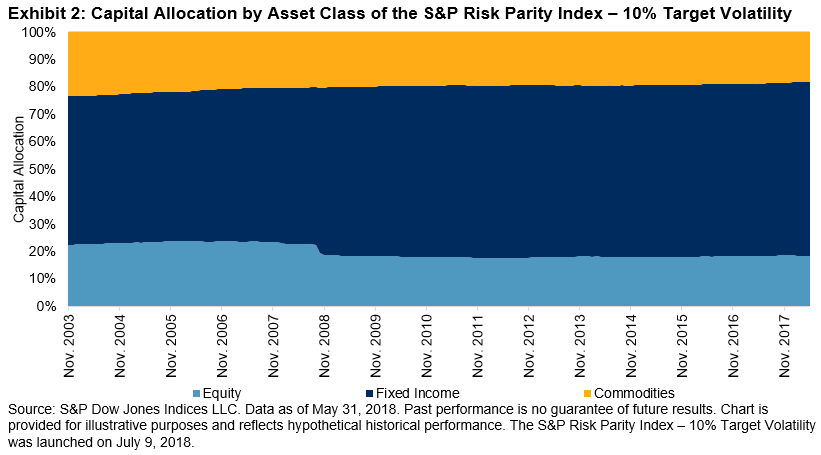
As seen in Exhibit 2, the historical capital allocation verifies that equal risk allocation did not lead to equal capital allocation. Fixed income, the least volatile asset class among the three, has the largest capital allocation to ensure its equal risk contribution to the portfolio. During the 14-year back-tested period, about 60% of the capital was allocated to fixed income securities (mean = 60.0%, median = 62.3%). The remaining 40% of the capital was split between equities (mean = 19.8%, median = 18.2%) and commodities (mean = 20.2%, median = 19.7%) almost evenly. The allocations among the three asset classes were fairly stable over time.

The posts on this blog are opinions, not advice. Please read our Disclaimers.

Juxtaposition and Paradox

Contributor Image
Anu Ganti

U.S. Head of Index Investment Strategy

S&P Dow Jones Indices

Effective prior to the market open on Sept. 24, 2018, the Telecommunication Services sector will be replaced with a new Communication Services sector, which will combine telecom with parts of the Information Technology and Consumer Discretionary sectors.

As a result, Telecom, the ugly duckling sector comprising three stodgy telephone companies, will now be joined by companies including Alphabet, Facebook, and Netflix. Given the addition of these younger juggernauts in the social media space, one might assume that the volatility of the new Communication Services sector would skyrocket. However, this is paradoxically not the case, and we can understand why using the lens of dispersion and correlation.

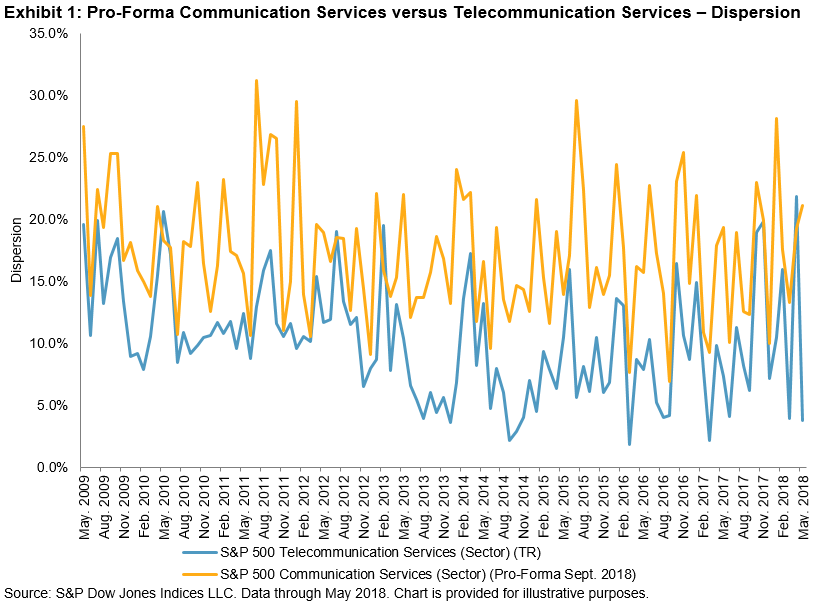
When comparing pro-forma indices with their current counterparts, we find that Consumer Discretionary and Info Tech’s historical dispersion and correlation levels are about the same. But when we look at Telecom versus the pro-forma Communication Services sector, as seen in Exhibit 1, we discover that the dispersion of Communication Services is consistently higher than that of Telecom. This is not a surprising outcome, given that the number of constituents increases from the current three and includes such names as Alphabet and Facebook, which have little in common with traditional telephone utilities.

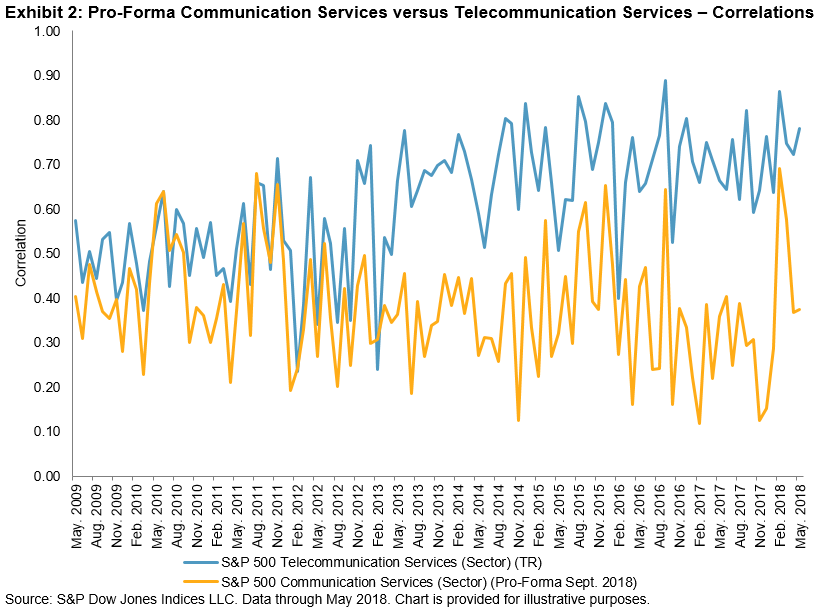
Moreover, as seen in Exhibit 2, the correlation of Communication Services is generally lower than that of Telecom. This result is again not surprising, given the fundamental differences between phone companies and the new names coming into the new sector.

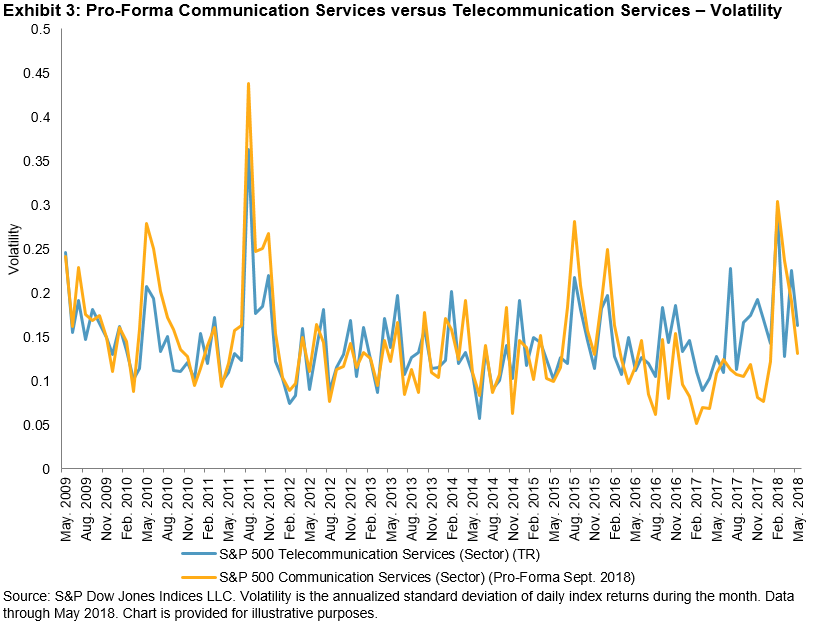
These findings have important implications for how the volatility of pro-forma Communication Services compares with that of Telecom, as volatility manifests itself in both dispersion and correlation. As shown by Exhibit 3, over time, the volatility of pro-forma Communication Services is roughly equal to that of Telecom. This results from the juxtaposition of two opposing forces: Communication Services’ higher dispersion, which drives volatility higher, is balanced by its lower correlations, which pull volatility lower. This is indeed an unexpected and notable outcome.

The posts on this blog are opinions, not advice. Please read our Disclaimers.