Get Indexology® Blog updates via email.

In This List

September Splits Commodities, Led By Strong Energy

A Framework for Offering Income in DC Plans

Looking Ahead to China’s 19th National Congress

Rieger Report: A Tale of Two Bond Markets

Green Bond Market: September 2017

September Splits Commodities, Led By Strong Energy

Contributor Image
Jodie Gunzberg

Former Managing Director, Head of U.S. Equities

S&P Dow Jones Indices

In September, three of five sectors were positive and thirteen of twenty four commodities were positive in the S&P GSCI Total Return that had an overall return of 3.3% in the month, 7.2% for the third quarter and -3.8% year-to-date.  Energy was the best performing sector for the month, returning 5.9%, while the precious metals sector lost the most, down 3.0% in September.  Gasoil was the winning single commodity for the month with a gain of 9.3%, and nickel lost 11.3% in the month, making it the most losing single commodity.

Source: S&P Dow Jones Indices

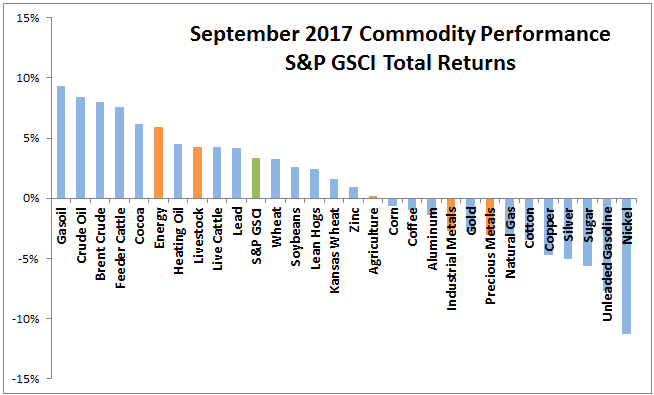
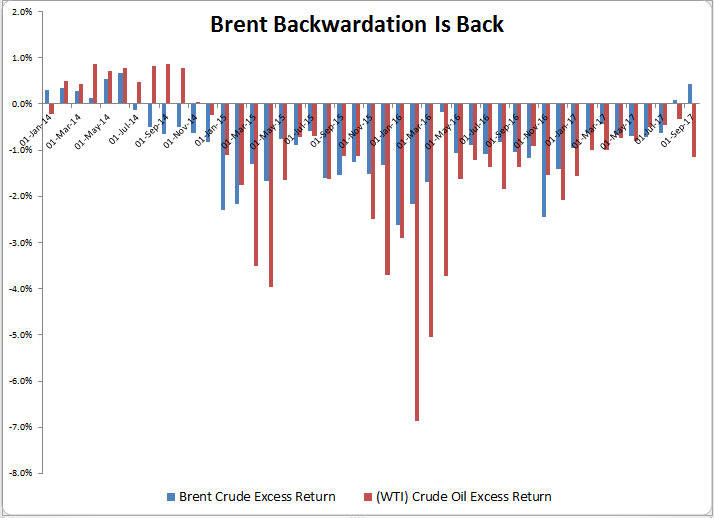
During the month, oil entered a bull market since the June 21, 2017 bottom with Brent Crude up 26.1% and (WTI) Crude Oil up 21.5% from better OPEC compliance, hurricane Harvey, and strong demand growth. Brent backwardation is the most since June 2014, and WTI crude oil contango was smallest since Dec 2014, before the storm but refinery disruptions and demand slowdown boosted the contango again to the highest since Jan 2017.

Source: S&P Dow Jones Indices

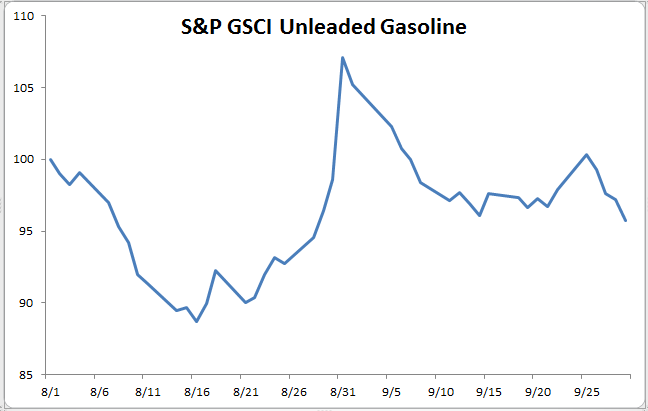
The after-effects of hurricanes generally have an impact on the commodities market. Hurricane Harvey caused gas prices to rise because the infrastructure needed to transport the gas to the refineries in Texas was badly damaged, but the price has come down as refineries come back online.

Source: S&P Dow Jones Indices

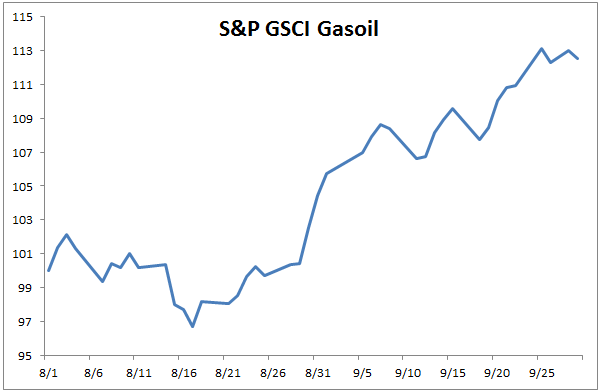
On the other hand, gasoil has continued to rise from not just the supply disruption, but also from the increased demand of fuel for machinery in construction for the rebuilding in the aftermath of the hurricanes.

Source: S&P Dow Jones Indices

Overall, the disruption to the energy supply led energy to have its best month yet in 2017, and again could be a solid foundation for the market to rebalance. On the flip side precious metals lost 3.0% in September, led by gold down 2.8%, posting the worst month (for both precious metals sector and gold single) not just this year but since Nov, 2016.  This is from a rising dollar and expectations of a rate hike.  This split shows the fundamentals are overtaking the aggregate demand in driving commodities today.

For more on quarterly performance, please see this article and this one too.

The posts on this blog are opinions, not advice. Please read our Disclaimers.

A Framework for Offering Income in DC Plans

Contributor Image
Jody Strakosch

Founder

Strakosch Retirement Strategies, LLC

According to the latest Department of Labor statistics, more than 640,000 employer-sponsored defined contribution (DC) plans are in existence in order to help nearly 90 million participants prepare for retirement.[1] To date, traditional measures of success included factors based on a plan’s inputs, such as participation rates, savings levels, and the relative performance of underlying investment options. Measuring these input-focused metrics may not, however, accurately capture a plan’s potential to provide its participants with retirement income adequacy (a common goal for most participants).  The Defined Contribution Institutional Investment Association (DCIIA) addressed this concern, creating a best practices framework[2] for plans with an objective of retirement income adequacy.  Key takeaways highlighted for plan sponsors include a need for updated plan design, an outcome-based Investment Policy Statement and new benchmarks for plan success.

Plan Design

When it comes to investment menu offerings, less may be more. While plan sponsors should seek to avoid overwhelming participants with too many options, the addition of a stand-alone income focused option may offer participants the ability to target a desired standard of living in retirement while concurrently signaling the need to consider income as a planning goal.  Research has shown that many American workers – even those approaching retirement – lack even a rudimentary retirement plan.  Of those who do have a plan, most plan a mere five years into retirement, rather than a far more likely retirement time horizon, such as 20-30 years.[3]   Now is the time for plan sponsors to evaluate the variety of available options and choose the arrangement that best suits their plan demographics.  Placing such an option alongside a conventional target date series, for example, may not only help participants plan for retirement income but also emphasize the importance of doing so!

Focusing on Outcomes

When evaluating the success of a retirement plan, sponsors should consider output-focused metrics, such as income replacement ratios by employee cohort.  An income replacement goal that takes employee demographics into consideration (such as salary) might be an appropriate metric for plan sponsors to consider.  One of the few studies that discuss replacement and savings rates by income cohort is by Massi De Santis and Marlena Lee[4]; the findings of which can be useful when designing an outcome-focused Investment Policy Statement (IPS).  Taking this step helps lay the foundation for what many plan sponsors are focusing on; the ability to better evaluate the success of an income focused default option and the plan as a whole.

Benchmarking Success

Many tools, such as the S&P Shift to Retirement Income and Decumulation (STRIDE) Index Series, which can serve as a benchmark for income-focused retirement strategies, are available from service providers to assist with this evaluation. It can also be important for sponsors to incorporate additional sources of income tools, such as Defined Benefit and Social Security payment estimates, to provide a more complete picture of participants’ sources of retirement income.

Measuring retirement readiness not only helps gauge the overall effectiveness of a DC plan, but it also helps identify at-risk employee populations that may require further attention to increase the likelihood of adequate retirement savings.  Focusing on income as the outcome is an important first step in helping participants meet their replacement income goals; effective progress means continuing to evaluate new income-focused solutions, improving plan metrics and utilizing relevant benchmarks to measure success.


4 Massi De Santis and Marlena Lee, “How Much Should I Save for Retirement”, Dimensional Fund Advisors, June 2013.

The S&P STRIDE INDEX is a product of S&P Dow Jones Indices LLC or its affiliates (“SPDJI”), and has been licensed for use by Dimensional Fund Advisors LP (“Dimensional”). Standard & Poor’s® and S&P® are registered trademarks of Standard & Poor’s Financial Services LLC (“S&P”); Dow Jones® is a registered trademark of Dow Jones Trademark Holdings LLC (“Dow Jones”); these trademarks have been licensed for use by SPDJI and sublicensed for certain purposes by Dimensional. Dimensional’s Products, as defined by Dimensional from time to time, are not sponsored, endorsed, sold, or promoted by SPDJI, S&P, Dow Jones, or their respective affiliates, and none of such parties make any representation regarding the advisability of investing in such products nor do they have any liability for any errors, omissions, or interruptions of the S&P STRIDE Index. Dimensional Fund Advisors LP receives compensation from S&P Dow Jones Indices in connection with licensing rights to S&P STRIDE Indices.

Dimensional Fund Advisors LP is an investment advisor registered with the Securities and Exchange Commission. Dimensional Fund Advisors and Strakosch Retirement Strategies are unaffiliated entities.

This article is offered only for general informational purposes; it does not constitute investment, tax, or legal advice and should not be relied on as such.

[1] U.S. Department of Labor Employee Benefits Security Administration, “Private Pension Plan Bulletin –

Abstract of Form 5500 Annual Reports,” October 2014.

[2] See DCIIA White Paper: Defined Contribution Plan Success Factors, Framework for Plans with an Objective of Retirement Income Adequacy, May 2015.

[3] Society of Actuaries, “2011 Risks and Process of Retirement Survey Report of Findings,” March 2012.

The posts on this blog are opinions, not advice. Please read our Disclaimers.

Looking Ahead to China’s 19th National Congress

Contributor Image
Vania Pang

Capital Markets and Investment Solutions, Index and Quantitative Investment

ICBC Credit Suisse Asset Management (International) Company Limited

The 19th National Congress of the Communist Party of China (CPC), one of the most important political events this year, will be convened on Oct 18. The reshuffling of the Politburo Standing Committee (PSC) members is crucial to the centralization of power for the new government, as well as the economic and social policies in the coming few years.  On the economic front, the continuity of the following policies may have significant impact to the capital markets.

Containing Financial Risks

The “two sessions” (The fifth sessions of the 12th National People’s Congress and the 12th National Committee of the Chinese People’s Political Consultative Conference) held in March set the tone for the upcoming party congress, at which containing financial risks and maintaining economic stability were emphasized. In the run-up of the congress, the government is working on deleveraging as evidenced by the decrease in the growth in M2. M2 grew 8.9% yoy in August 2017, hitting a record low since 1996.[1] Moreover, eight cities rolled out housing tightening measures ahead of the congress, with most banning home sales within two to three years after purchases.[2] It showed that the government is determined to curb the property bubble. It is believed that the new government will continue to guard the economy against financial shocks.

Structural Reforms

Over the past few years, the government is committed to supply-side reform, by which overcapacity is being reduced, resulting the pick-up of PPI and industrial enterprises profits. Regarding state-owned enterprises (SOEs) reform, 32 SOEs have accomplished restructuring since 2013, according to Premier Li Keqiang. As a result, management and operation costs decreased and efficiency improved, leading to 40% increase in profits from 2012 to 2016 for the restructured SOEs.[3] The pace of SOEs reform could be accelerated if political power is consolidated by the political reshuffle.

Investment Outlook

Stability is the key to the economic development of China. We believe the new government will pay the utmost effort to rein in risks and promote sustainable growth. Deleverage may challenge the financial sector in the short-term but will lead to healthier growth in the long-term. We expect new economy sectors such as Information Technology, Consumer and Health Care are less affected by the transitions of powers.

Chinese equities advanced solidly in August benefited from resilient corporate earnings and stable macro environment before the congress. The S&P China 500 Index recorded a strong growth of 32.59% YTD (as of Aug 31, 2017).

The S&P China 500 Index underweights financial sector (25%) comparing to FTSE A50 (64%), CSI300 (37%) and HSCEI (73%) as of Aug 31, 2017. More weights are distributed to new economy sectors, such as I.T. (21%), consumer discretionary (12%).

Benefited from its diversification in markets and sectors exposure, S&P China 500 has demonstrated better risk-adjusted returns (Figure 2). During the period from 31 Dec, 2008 to 31 Aug, 2017, the S&P China 500 generated an annualized return of 12.5% and Sharpe ratio of 0.55, both are the highest among the major China indices.

[1] Reuters, 15 Sep 2017. http://www.reuters.com/article/us-china-economy-loans/china-august-yuan-loans-surprisingly-strong-but-growth-may-have-peaked-idUSKCN1BQ1B8

[2] Xinhua News Agent, 24 Sep 2017. http://english.sina.com/news/2017-09-25/detail-ifymeswc9682142.shtml

[3] CCTV, 27 Sep 2017. http://tv.cctv.com/2017/09/27/VIDETF3iPrConyjT1zdxT8W6170927.shtml

DISCLAIMERS
The S&P China 500 Index is a product of S&P Dow Jones Indices LLC and/or its affiliates and has been licensed for use by ICBC Credit Suisse Asset Management (International) Co., Ltd. (ICBCCSI), © 2017 S&P Dow Jones Indices LLC, a division of S&P Global. All rights reserved.  S&P and S&P 500 are registered trademarks of Standard & Poor’s Financial Services LLC, a division of S&P Global (“S&P”). DOW JONES is a registered trademark of Dow Jones Trademark Holdings LLC (“Dow Jones”). These trademarks together with others have been licensed to S&P Dow Jones Indices LLC. Redistribution, reproduction and/or photocopying in whole or in part are prohibited without written permission. This document does not constitute an offer of services in jurisdictions where S&P Dow Jones Indices LLC, Dow Jones, S&P or their respective affiliates (collectively “S&P Dow Jones Indices”) do not have the necessary licenses. All information provided by S&P Dow Jones Indices is impersonal and not tailored to the needs of any person, entity or group of persons. S&P Dow Jones Indices receives compensation in connection with licensing its indices to third parties. Past performance of an index is not a guarantee of future results. Neither S&P Dow Jones Indices LLC, Dow Jones, S&P, and their respective affiliates (“S&P Dow Jones Indices”) nor their third party licensors make any representation or warranty, express or implied, as to the ability of any index to accurately represent the asset class or market sector that it purports to represent and neither S&P Dow Jones Indices nor their third party licensors shall have any liability for any errors, omissions, or interruptions of any index or the data included therein.
In this document, ICBC Credit Suisse refers to ICBC Credit Suisse Asset Management Company Limited and its subsidiary, ICBC Credit Suisse Asset Management (International) Company Limited (“ICBCCSI”). ICBCCSI is a regulated entity under the Hong Kong Securities and Futures Commission.
No account has been taken of any person’s investment objectives, financial situation or particular needs when preparing this document. This is not an offer to buy or sell, or a solicitation or incitement of offer to buy or sell, any particular security, strategy, investment product or services nor does this constitute investment advice or recommendation.
The views and opinions expressed in this document, which are subject to change without notice, are those of S&P Dow Jones Indices LLC, ICBC Credit Suisse and/or its affiliated companies at the time of publication. While S&P Dow Jones Indices LLC, ICBC Credit Suisse and/or its affiliated companies (collectively as “we” or “us”) believe that the information is correct at the date of this presentation, no warranty of representation is given to this effect and no responsibility can be accepted by us to any intermediaries or end users for any action taken on the basis of this information. Some of the information contained herein including any expression of opinion or forecast has been obtained from or is based on sources believed by us to be reliable as at the date it is made, but is not guaranteed and we do not warrant nor do we accept liability as to adequacy, accuracy, reliability or completeness of such information.  The information is given on the understanding that any person who acts upon it or otherwise changes his or her position in reliance thereon does so entirely at his or her own risk without liability on our part.
This material has not been reviewed by the Hong Kong Securities and Futures Commission.  Issuer of this material: ICBC Credit Suisse Asset Management (International) Company Limited. This material shall be distributed in countries where it is permitted.
INDEX PERFORMANCE DISCLOSURE
The S&P China 500 was launched on August 28, 2015. All information presented prior to an index’s Launch Date is hypothetical (back-tested), not actual performance. The back-test calculations are based on the same methodology that was in effect on the index Launch Date. Complete index methodology details are available at www.spdji.com. Please read S&P Dow Jones Indices LLC’s DISCLAIMERS.

The posts on this blog are opinions, not advice. Please read our Disclaimers.

Rieger Report: A Tale of Two Bond Markets

Contributor Image
J.R. Rieger

Former Head of Fixed Income Indices

S&P Dow Jones Indices

The U.S. corporate and municipal bond markets seem to be neck and neck in total return performance for the first three quarters of 2017.  However, there are distinct characteristics of both of these markets that have played a key role and could cause the performance to vary significantly going forward.

The intent of this blog post is to bring top of mind some of the potential drivers of performance in each market.

Coupon cash flow: Investment grade, tax-exempt municipal bonds tracked in the S&P National AMT-Free Municipal Bond Index have an average coupon of 4.61% vs. the average coupon of 3.72% of the bonds in the S&P 500/MarketAxess Investment Grade Corporate Bond IndexIn a low yield and low expected return environment municipal bonds offer higher interest rate cash flow that is tax-exempt.  Advantage: Municipal bonds 

Yield: Investment grade tax-exempt municipal bonds on average are yielding 2.03% vs. higher yielding taxable investment grade corporate bonds.  However, looking at it from the perspective of Taxable Equivalent Yield (TEY) municipal bonds are currently at higher yields than their corporate bond equivalents.  Please refer to table below.  Advantage: Municipal bonds

Duration: Investment grade corporate bonds of the issuers of the S&P 500 Index are tracked in the S&P 500/MarketAxess Investment Grade Corporate Bond Index.  Their average duration is over 7.75 vs. an average of 4.8 for investment grade municipal bonds tracked in the S&P National AMT-Free Municipal Bond Index. In general, in a rising rate environment the lower duration favors municipal bonds.  Advantage: Municipal Bonds

Market size: U.S. corporate bonds that are index eligible tend to be very large issues.  The market size of the corporate bond market tracked in the S&P 500 Bond Index (broad index) is over $4.5trillion.  The broad S&P Municipal Bond Index tracks over $1.77trillion of the $3.8trillion municipal bond market. The larger corporate bond market tends to be more liquidAdvantage : corporate bonds

Diversity & number of bond issues: The nearly 100,000 bond issues tracked in the S&P Municipal Bond Index illustrates that the municipal market has many smaller and less frequent issuers than the corporate bond market.  This can result in secondary market liquidity being significantly less for municipal bonds than bonds in the corporate bond market. Municipal  bond buyers typically demand a higher yield for this illiquidity – “Liquidity Premium”. Advantage : corporate bonds

New issue supply:  Supply of new issue corporate bonds is on a high pace as compared to last year and demand remains strong with many new issues being over-subscribed (more buyers seeking bonds than bonds being sold.)  While demand for municipal bonds continues to be extremely strong, new issue supply remains lower than previous years.  However, there are some larger municipal bonds on the calendar for sale. Supply is something to keep an eye on for both markets.

Headline risk:  Municipal bonds are heavily a retail product and as a result retail sentiment can play a big role in market performance. Real fiscal challenges in both large and small municipalities add to the risk already impacting the market from issuers in Puerto Rico, Illinois and Connecticut. The corporate bond market is currently enjoying a period of lower historical default rates while the municipal bond market is wrestling with the largest default in it’s history – Puerto Rico.  Advantage : corporate bonds

Tax code changes:  Early days, but the impact of potential tax code changes on both of these markets could be a major factor in performance.

These are some of the factors I keep top of mind to understand the drivers of performance of the corporate and municipal bond markets. As for the future;  Bob Dylan once wrote “don’t speak too soon as the wheel’s still in spin” and these are certainly times that are changing.

Table 1: Select bond market indices and their characteristics:

Source: S&P Dow Jones Indices, LLC. Data as of September 29, 2017. Table is provided for illustrative purposes. It is not possible to invest directly in an index. Past performance is no guarantee of future results.

The posts on this blog are opinions, not advice. Please read our Disclaimers.

Green Bond Market: September 2017

Contributor Image
Dennis Badlyans

Former Associate Director, Global Research & Design

S&P Dow Jones Indices

In the first three quarters of 2017, green bond issuance reached USD 83 billion, nearing the issuance reported by the Climate Bond Initiative for full-year 2016 (see Exhibit 1).  France accounted for 18% (USD 14.8 billion) of the issuance, driven primarily by the USD 7.6 billion sovereign bond issued by the country in January. Commercial banks issued 44% of the USD 12.4 billion of capital raised in China to fund green projects.  U.S. municipals continue to account for about half of the U.S. issuance YTD, however asset-backed securities continue to increase market share.  Fannie Mae, a newcomer in 2017, issued its fourth green ABS in August, bringing its YTD total to USD 1.8 billion of USD 11.4 billion issued in the U.S. market through the end of Q3 17 (see Exhibit 2).

Over 80% of the green bonds issued in 2017 have qualified for the S&P Green Bond Index, which is designed to track the global green market.  Nearly 80% of those bonds have qualified for the S&P Green Bond Select Index, which further limits exposure subject to stringent financial and extra-financial eligibility criteria (see Exhibit 3).  As of Sept. 29, 2017, the global green market has USD 232.2 billion of outstanding debt, USD 209.7 billion of which is included in the S&P Green Bond Index and USD 165.7 billion in the S&P Green Bond Select Index.

The continuing trend of broader representation by issuers, asset types, and currencies makes the S&P Green Bond Index a suitable substitute for global aggregate exposure.  In terms of performance, monthly returns are highly correlated with the S&P Global Developed Aggregate ex-Collateralized Bond Index (USD) (see Exhibit 4).

The posts on this blog are opinions, not advice. Please read our Disclaimers.