The U.S. Treasury yield curve, as represented by the S&P U.S. Treasury Bond Current Indices, ended June 14, 2017, tighter (lower in yield) than the previous day. The importance of June 14 is that it was the day on which the U.S. Federal Reserve raised the target rate by 25 bps, from 1% to 1.25%. The following day, the yield curve increased, but only by an average of 2 bps.
The yield on the two-year bond, as measured by the S&P U.S. Treasury Bond Current 2-Year Index, remained consistent and actually ended June at 1.37%, only 1 bp higher than the day after the rate hike. As shown in Exhibit 1, the spread between the 2-year and the 30-year U.S. Treasury bond trended downward for most of June. The yield of the 30-year bond was 2.86% the day prior to the rate hike and moved as low as a 2.70% on June 26, 2017, before moving back up to close the month at 2.83%. The result of this was a flatter yield curve for most of June and can be seen in Exhibit 2 as the comparison between the yellow and navy yield curves.
Exhibit 1: 2-year versus 30-year U.S. Treasury Spread

Exhibit 2: Yield Curve

The pivotal point for the U.S. Treasury curve happened on June 27, 2017, and the influence on valuation came not from the U.S., but from Europe. Mario Draghi, President of the European Central Bank (ECB), made comments in regard to the ECB’s ability to adjust its policy tools of sub-zero interest rates and bond purchases as the economic condition improves in Europe. Draghi’s comments resulted in higher yields and speculation that the ECB and possibly others were poised to start withdrawing monetary policy stimulus.
Since June 27, 2017, yields across the curve have continued to rise (see Exhibit 2) and the curve flattening has ended.
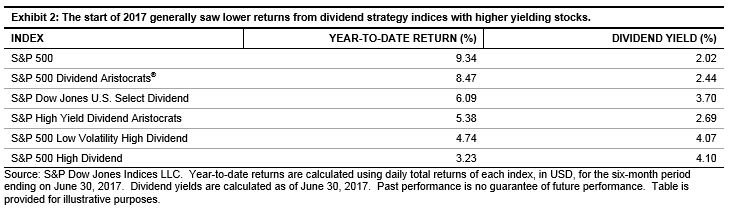
Exhibit 3: Index Data