Get Indexology® Blog updates via email.

In This List

Mightier than Le Pen

Inflation and the Fed

Asian Fixed Income: The Birth of Bond Connect

Embracing the globalization of Chinese equities

Most S&P and Dow Jones Islamic Indices Outperform Conventional Benchmarks in 2017

Mightier than Le Pen

Contributor Image
Hamish Preston

Head of U.S. Equities

S&P Dow Jones Indices

We publish a series of dashboards at the end of each month to summarize market performance in a number of regions. These dashboards include monthly reports on Risk and Volatility, as well as Factor Dashboards for the U.S. and for Europe on a quarterly basis. With June behind us, a half-yearly summary is in order. Highlighted below are two key themes and trends that have emerged in Europe during the first two quarters of 2017.

The French election caused concern, but the Centrist was mightier than Le Pen.

There were significant elections in Europe during the past six months. Those in the Netherlands and (especially) in France were seen as barometers for Euroscepticism on the continent. They also allowed investors to see whether there would be a continuation of the trend towards economic nationalism and populism that has been observed in various countries globally.

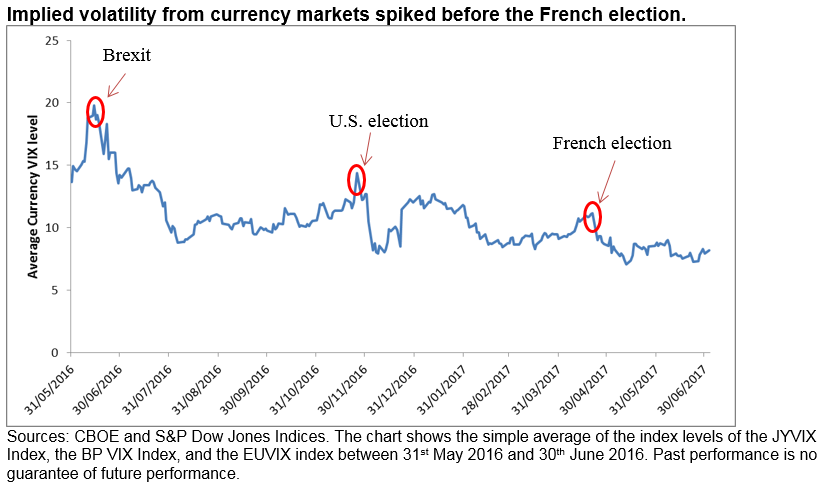
Following the surprise results in several votes in 2016, many investors had come to treat polling data with some suspicion. The possibility of ‘Frexit’ in the event of a victory for Marine Le Pen’s National Front heightened the tension. This nervousness over the outcome of the elections and focus on political risk can be observed in the implied volatility of the currency markets. Taking the average of three such measures – the CBOE/CME FX Yen Volatility IndexSM, the CBOE/CME FX British Pound Volatility IndexSM, and the CBOE EuroCurrency Volatility Index – it is clear that investors’ volatility expectations for the three currency markets have trended downwards over the past year. Nevertheless, there was an increase in average volatility expectations for the three currencies leading up to the French election and a fall once the outcome was observed. We could also observe this pattern around the time of the U.K. Brexit referendum and the U.S. general election.

Brexit weighed on equity market performance

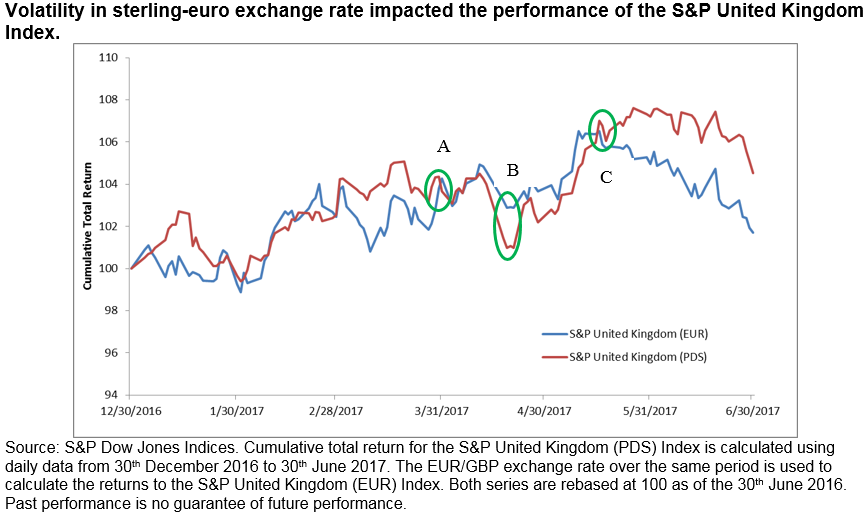
After months of speculation about when the U.K. would formally notify the European Union of its intention to leave, Prime Minister Theresa May announced that the two year negotiation period would commence at the end of March (point A in the chart below). Rather than turning attention to the negotiation immediately, however, the Prime Minister’s decision to call a snap election (point B in the chart) propelled U.K. politics into the limelight once again.

Expectations of an increased majority for the incumbent Conservative Party, which was seen as making a “soft” Brexit more likely, initially helped sterling appreciate against the euro. The impact of the currency movement was evident from the strong performance of the S&P United Kingdom Index (in pounds sterling) in May compared to the same index denominated in euros. The subsequent tightening of the polls (point C) and the realization that no political party had secured a Parliamentary majority saw a complete reversal in this trend.

The posts on this blog are opinions, not advice. Please read our Disclaimers.

Inflation and the Fed

Contributor Image
David Blitzer

Former Managing Director and Chairman of the Index Committee

S&P Dow Jones Indices

Despite today’s very low inflation the Fed keeps raising interest rates and is now discussing when to shrink its balance sheet to further tighten monetary policy.  The Fed’s own inflation forecast anticipates continued low inflation at 1.6% in 2017 creeping up to 2% in 2018 and 2019 and not seeing any increase later on. Moreover, consumers and the public have similar expectations for low inflation now and in the future. So why is the central bank pushing interest rates higher?

The principal reason is the belief that a low and falling unemployment rate is a reliable signal of future inflation.  This is part of the received wisdom of economic policy which has some basis in the data. It originated with work done by a New Zealand economist, A. W. Phillips, in 1958 comparing unemployment and changes in wages in Great Britain from 1861 to 1957.  Phillips found a consistent relation that showed lower unemployment rates were associated with higher rates of wage inflation.  While the original finding was empirical – based on the data rather than economic theory – the idea soon became the basis for various theories of what causes inflation and how economic policy could lower either inflation or unemployment.

Current data on the U.S. economy since 2000 reveals similar patterns. The first chart shows the unemployment rate and the inflation rate (measured as the year-over-year change in the Core Personal Consumption Expenditures deflator) from January 2000 to May 2017.  As shown, when unemployment rose in 2008, inflation fell, suggesting an inverse relation.  The second figure is the Phillips curve of inflation and unemployment. It plots the unemployment rate on the horizontal axis and the inflation rate on the vertical axis. The regression line indicates that a one percentage point increase in unemployment is associated with a one-tenth of one percentage point decline in inflation.

The Phillips curve doesn’t prove that falling unemployment causes higher inflation. However the idea of a trade-off between inflation and unemployment is embedded in a lot of economic thought. Economists who remember the high inflation of the 1970s and the pain of the 1980 and 1981-2 recessions when unemployment surged and inflation collapsed pay attention to the Phillips curve. The experience of the last 12 months when both inflation and unemployment fell together isn’t enough to erase the Phillips curve.

Based on a combination of experience, data and economic theory, the Fed believes that continued declines in unemployment point to higher inflation rates. At some point the unemployment rate will hit bottom, inflation will be driven higher and a series of rapid increases in interest rates will be necessary. The result of that move could be a recession.

A related argument for gradual increases in interest rates is to prepare for the next recession: Were the economy to contract and the unemployment rate to rise, the Fed would want to lower interest rates. With the fed funds rate at 1.0%-1.25% and ten year treasuries trading at 2.4%, there isn’t much room to cut.  If the Fed slowly pushes interest rates back to more normal levels with the Fed Funds rate at 3%, its ability to stimulate the economy during a recession would be improved.

The posts on this blog are opinions, not advice. Please read our Disclaimers.

Asian Fixed Income: The Birth of Bond Connect

Contributor Image
Michele Leung

Former Director, Fixed Income Indices

S&P Dow Jones Indices

As a follow up to the previous article, Bond Connect officially launched on July 3, 2017. Bond Connect allows international market participants to trade China’s interbank bonds through the Hong Kong Stock Exchange.  It marked a milestone in China to further open up its capital market, following the China Interbank Bond Market (CIBM) announcement last year. Let’s take a closer look at the recent developments of China onshore bond market.

Similar to other existing channels, like RQFII and CIBM, Bond Connect allows market participants to access China’s onshore bond market, yet through the trade custody and settlement infrastructure connect features, Bond Connect is more cost and time effective for some market participants. As expressed by Bond Connect Company Ltd*, it significantly reduces the account opening time to three working days and improves the price discovery with electronic trading.

According to Mr. Pan*, Deputy Governor from People’s Bank of China, a total of 479 financial institutions invested in the China bond market with over RMB 800 billion under several schemes. The participation of overseas market participants is still low, around 3.9% in government bonds and 1.2% in overall bond markets.  It is unparalleled to the size of the China bond market, which was RMB 53 trillion as tracked by the S&P China Bond Index, hence there is further room for internationalization.

In terms of market performance, the total return of the S&P China Bond Index fell -0.49% year-to-date (YTD), while its yield-to-maturity tightened 23 bps to 4.31% during the same period, data as of July 3, 2017.  The index currently tracks the performance of 9,650 government and corporate bonds from China.  The S&P China Government Bond Index represents over 66% of the overall exposure, with a market value of RMB 35 trillion.

The S&P China Corporate Bond Index has expanded rapidly in the past 10 years, as the market value tracked by the index was RMB 18 trillion, which has increased 34-fold since the index’s first value date on Dec. 29, 2006, and the yield-to-maturity stood at 5.04% with a modified duration of 2.44 (see Exhibit 2 for the yield comparison).

On the back of the growth story, attractive yields, and diversification, the allocations in China’s onshore bonds are poised to rise in the coming years, particularly with the new accesses through Bond Connect and CIBM.

Exhibit 1: Market Value of the S&P China Corporate Bond Index and S&P China Government Bond Index

Exhibit 2: Yield-to-Maturity of the S&P China Corporate Bond Index and S&P China Government Bond Index

*Source: Bond Connect Investor Forum on July 3, 2017.

The posts on this blog are opinions, not advice. Please read our Disclaimers.

Embracing the globalization of Chinese equities

Contributor Image
Vania Pang

Capital Markets and Investment Solutions, Index and Quantitative Investment

ICBC Credit Suisse Asset Management (International) Company Limited

For being the second largest capital market and the second largest economy in the world, China is underrepresented in most of the international benchmarks, which is unparalleled with its significance to the world economy. With increased access to the Chinese domestic equities market, one of the largest index compilers received broad support from international investors with whom they consulted and recently announced it would include China A-shares into its benchmark indexes.

  1. Liberalization of capital markets fostering globalization of China assets

The impact of the inclusion in the initial stage is expected to be modest, due to the limited inclusion factor. Nevertheless, the decision shows that the China A market has gained recognition from international investors and cannot be neglected. The globalization of Chinese securities is inevitable and in progress. The opening up of China’s capital market has been accelerated in the past few years, as evidenced by the launch of QFII, RQFII and Stock Connect programs. CSRC Vice Chairman Mr. Fang Xinghai mentioned that they would consider increasing the Connect daily quota and reforming the QFII quota system for better foreign access[1].

Once the capital market of China is liberalized, it is believed that Chinese equities will become more prominent in the portfolios of global assets allocators in order to reflect the importance and influence of its economy and financial markets. With the expectation of China’s gradual increase in weighting in international benchmarks, global investors are called to pre-position themselves for the irreversible trend of China assets globalization. A broad-based index and related investment products which can better represent the Chinese economy would be an ideal building block of global and/or regional equity portfolios.

  1. S&P China 500 – in response to increasing market demand for a “Total China” index

Against the backdrop of broadened capital flows between domestic China and international markets, the demand for benchmarks that integrate the China onshore and offshore listings has been increasing. In response to market demand, the S&P China 500 was launched to offer more complete China coverage by including both onshore and offshore Chinese equities.

The S&P China 500  covers the 500 largest and most liquid Chinese companies, regardless of their listing venue, including the entire universe of Chinese equities, such as A, B, H, Red Chip, P Chip and Chinese securities listed in the U.S. or any other overseas exchanges.

Compared to other major China indices, the S&P China 500 offers a more diversified sector exposure (Figure 1). It is much less concentrated in financials (23%) compared to FTSE A50 (64%), CSI 300 (35%), MSCI China (25%) and HSCEI (72%) as of May 31, 2017. More weight is distributed to new economy sectors, such as I.T. (19%) and consumer discretionary (13%).

Benefiting from its diversification in markets and sectors exposure, the S&P China 500 has demonstrated better risk-adjusted returns (Figure 2). During the period from Dec. 31, 2008, to May 31, 2017, the S&P China 500 generated an annualized return of 10.9% and Sharpe ratio of 0.48; both are the highest among the major China indices.

The S&P China 500 offers more comprehensive market coverage while approximating the sector composition of the broader Chinese equity market, and this makes it a better proxy for the Chinese economy.

[1] Source: Ming Pao, 22 June, 2017. https://news.mingpao.com/pns/dailynews/web_tc/article/20170622/s00004/1498067626316

DISCLAIMERS
The S&P China 500 Index is a product of S&P Dow Jones Indices LLC and/or its affiliates and has been licensed for use by ICBC Credit Suisse Asset Management (International) Co., Ltd. (ICBCCSI), © 2016 S&P Dow Jones Indices LLC, a division of S&P Global. All rights reserved.  S&P, SPDR and S&P 500 are registered trademarks of Standard & Poor’s Financial Services LLC, a division of S&P Global (“S&P”). DOW JONES is a registered trademark of Dow Jones Trademark Holdings LLC (“Dow Jones”). These trademarks together with others have been licensed to S&P Dow Jones Indices LLC. Redistribution, reproduction and/or photocopying in whole or in part are prohibited without written permission. This document does not constitute an offer of services in jurisdictions where S&P Dow Jones Indices LLC, Dow Jones, S&P or their respective affiliates (collectively “S&P Dow Jones Indices”) do not have the necessary licenses. All information provided by S&P Dow Jones Indices is impersonal and not tailored to the needs of any person, entity or group of persons. S&P Dow Jones Indices receives compensation in connection with licensing its indices to third parties. Past performance of an index is not a guarantee of future results. Neither S&P Dow Jones Indices LLC, Dow Jones, S&P, and their respective affiliates (“S&P Dow Jones Indices”) nor their third party licensors make any representation or warranty, express or implied, as to the ability of any index to accurately represent the asset class or market sector that it purports to represent and neither S&P Dow Jones Indices nor their third party licensors shall have any liability for any errors, omissions, or interruptions of any index or the data included therein.
In this document, ICBC Credit Suisse refers to ICBC Credit Suisse Asset Management Company Limited and its subsidiary, ICBC Credit Suisse Asset Management (International) Company Limited (“ICBCCSI”). ICBCCSI is a regulated entity under the Hong Kong Securities and Futures Commission.
No account has been taken of any person’s investment objectives, financial situation or particular needs when preparing this document. This is not an offer to buy or sell, or a solicitation or incitement of offer to buy or sell, any particular security, strategy, investment product or services nor does this constitute investment advice or recommendation.
The views and opinions expressed in this document, which are subject to change without notice, are those of S&P Dow Jones Indices LLC, ICBC Credit Suisse and/or its affiliated companies at the time of publication. While S&P Dow Jones Indices LLC, ICBC Credit Suisse and/or its affiliated companies (collectively as “we” or “us”) believe that the information is correct at the date of this presentation, no warranty of representation is given to this effect and no responsibility can be accepted by us to any intermediaries or end users for any action taken on the basis of this information. Some of the information contained herein including any expression of opinion or forecast has been obtained from or is based on sources believed by us to be reliable as at the date it is made, but is not guaranteed and we do not warrant nor do we accept liability as to adequacy, accuracy, reliability or completeness of such information.  The information is given on the understanding that any person who acts upon it or otherwise changes his or her position in reliance thereon does so entirely at his or her own risk without liability on our part.
This material has not been reviewed by the Hong Kong Securities and Futures Commission.  Issuer of this material: ICBC Credit Suisse Asset Management (International) Company Limited. This material shall be distributed in countries where it is permitted.
INDEX PERFORMANCE DISCLOSURE
The S&P China 500 was launched on August 28, 2015. All information presented prior to an index’s Launch Date is hypothetical (back-tested), not actual performance. The back-test calculations are based on the same methodology that was in effect on the index Launch Date. Complete index methodology details are available at www.spdji.com. Please read S&P Dow Jones Indices LLC’s DISCLAIMERS.

The posts on this blog are opinions, not advice. Please read our Disclaimers.

Most S&P and Dow Jones Islamic Indices Outperform Conventional Benchmarks in 2017

Contributor Image
Michael Orzano

Head of Global Exchanges Product Management

S&P Dow Jones Indices

Most S&P and Dow Jones Shariah-compliant benchmarks outperformed their conventional counterparts year-to-date through June 28, 2017 as Financials – which are largely absent from Islamic indices – have lagged the broader market, and Information Technology and Health Care – which tend to be overweight in Islamic Indices – have been the two top performing sectors so far this year.

Global equity markets added to strong Q1 gains as the Dow Jones Islamic Market World and S&P Global BMI Shariah Indices gained 13.6% and 13.3%, respectively for the year.  Each index outperformed the conventional S&P Global Broad Market Index (BMI) by about 2.5%.  In the U.S., the S&P 500 Shariah gained 10.4% for the year, outperforming the S&P 500 by 1.4%.  Regional Dow Jones Islamic Market benchmarks for Asia-Pacific, Europe and Emerging Markets all beat their conventional counterparts by meaningful margins as well.

Asia-Pacific, Europe and Emerging Markets Lead Global Equity Markets Higher

Gains were broad based across global equity markets.  However, Asia-Pacific, Europe and Emerging Markets have led the way as improved economic prospects and investor sentiment along with strengthening currencies contributed to high double-digit U.S. dollar denominated returns.   Despite recently lagging other major regions, U.S. equity markets have remained strong as the S&P 500 recorded several new all-time highs in 2017 and was up 9.0% year-to-date through June 28.

Weak Oil Prices and Political Uncertainty Weigh on MENA Equities

After a strong finish to 2016, MENA equities have significantly lagged global equity markets in 2017 as falling oil prices and political uncertainty arising from the diplomatic rift between several Arab nations and Qatar weighed on the region’s equity markets.  The S&P Pan Arab Composite Shariah eked out a gain of 1.0% year-to-date through June 27, matching the return of the conventional S&P Pan Arab Composite Shariah.  The S&P Qatar BMI sank 13.2% over the same period with most of the losses concentrated following the June 5 flare up of diplomatic tensions.

The posts on this blog are opinions, not advice. Please read our Disclaimers.