Get Indexology® Blog updates via email.

In This List

Asian Fixed Income: The Birth of Bond Connect

Embracing the globalization of Chinese equities

Most S&P and Dow Jones Islamic Indices Outperform Conventional Benchmarks in 2017

Energy Just Had Its Worst Start in 19 Years

Green Bonds: Addressing Solvency II Benchmarking Requirements

Asian Fixed Income: The Birth of Bond Connect

Contributor Image
Michele Leung

Former Director, Fixed Income Indices

S&P Dow Jones Indices

As a follow up to the previous article, Bond Connect officially launched on July 3, 2017. Bond Connect allows international market participants to trade China’s interbank bonds through the Hong Kong Stock Exchange.  It marked a milestone in China to further open up its capital market, following the China Interbank Bond Market (CIBM) announcement last year. Let’s take a closer look at the recent developments of China onshore bond market.

Similar to other existing channels, like RQFII and CIBM, Bond Connect allows market participants to access China’s onshore bond market, yet through the trade custody and settlement infrastructure connect features, Bond Connect is more cost and time effective for some market participants. As expressed by Bond Connect Company Ltd*, it significantly reduces the account opening time to three working days and improves the price discovery with electronic trading.

According to Mr. Pan*, Deputy Governor from People’s Bank of China, a total of 479 financial institutions invested in the China bond market with over RMB 800 billion under several schemes. The participation of overseas market participants is still low, around 3.9% in government bonds and 1.2% in overall bond markets.  It is unparalleled to the size of the China bond market, which was RMB 53 trillion as tracked by the S&P China Bond Index, hence there is further room for internationalization.

In terms of market performance, the total return of the S&P China Bond Index fell -0.49% year-to-date (YTD), while its yield-to-maturity tightened 23 bps to 4.31% during the same period, data as of July 3, 2017.  The index currently tracks the performance of 9,650 government and corporate bonds from China.  The S&P China Government Bond Index represents over 66% of the overall exposure, with a market value of RMB 35 trillion.

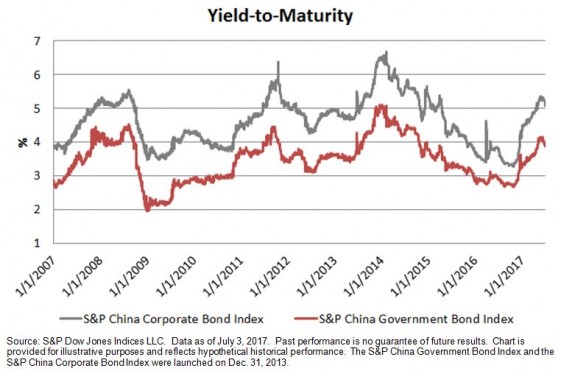
The S&P China Corporate Bond Index has expanded rapidly in the past 10 years, as the market value tracked by the index was RMB 18 trillion, which has increased 34-fold since the index’s first value date on Dec. 29, 2006, and the yield-to-maturity stood at 5.04% with a modified duration of 2.44 (see Exhibit 2 for the yield comparison).

On the back of the growth story, attractive yields, and diversification, the allocations in China’s onshore bonds are poised to rise in the coming years, particularly with the new accesses through Bond Connect and CIBM.

Exhibit 1: Market Value of the S&P China Corporate Bond Index and S&P China Government Bond Index

Exhibit 2: Yield-to-Maturity of the S&P China Corporate Bond Index and S&P China Government Bond Index

*Source: Bond Connect Investor Forum on July 3, 2017.

The posts on this blog are opinions, not advice. Please read our Disclaimers.

Embracing the globalization of Chinese equities

Contributor Image
Vania Pang

Capital Markets and Investment Solutions, Index and Quantitative Investment

ICBC Credit Suisse Asset Management (International) Company Limited

For being the second largest capital market and the second largest economy in the world, China is underrepresented in most of the international benchmarks, which is unparalleled with its significance to the world economy. With increased access to the Chinese domestic equities market, one of the largest index compilers received broad support from international investors with whom they consulted and recently announced it would include China A-shares into its benchmark indexes.

  1. Liberalization of capital markets fostering globalization of China assets

The impact of the inclusion in the initial stage is expected to be modest, due to the limited inclusion factor. Nevertheless, the decision shows that the China A market has gained recognition from international investors and cannot be neglected. The globalization of Chinese securities is inevitable and in progress. The opening up of China’s capital market has been accelerated in the past few years, as evidenced by the launch of QFII, RQFII and Stock Connect programs. CSRC Vice Chairman Mr. Fang Xinghai mentioned that they would consider increasing the Connect daily quota and reforming the QFII quota system for better foreign access[1].

Once the capital market of China is liberalized, it is believed that Chinese equities will become more prominent in the portfolios of global assets allocators in order to reflect the importance and influence of its economy and financial markets. With the expectation of China’s gradual increase in weighting in international benchmarks, global investors are called to pre-position themselves for the irreversible trend of China assets globalization. A broad-based index and related investment products which can better represent the Chinese economy would be an ideal building block of global and/or regional equity portfolios.

  1. S&P China 500 – in response to increasing market demand for a “Total China” index

Against the backdrop of broadened capital flows between domestic China and international markets, the demand for benchmarks that integrate the China onshore and offshore listings has been increasing. In response to market demand, the S&P China 500 was launched to offer more complete China coverage by including both onshore and offshore Chinese equities.

The S&P China 500  covers the 500 largest and most liquid Chinese companies, regardless of their listing venue, including the entire universe of Chinese equities, such as A, B, H, Red Chip, P Chip and Chinese securities listed in the U.S. or any other overseas exchanges.

Compared to other major China indices, the S&P China 500 offers a more diversified sector exposure (Figure 1). It is much less concentrated in financials (23%) compared to FTSE A50 (64%), CSI 300 (35%), MSCI China (25%) and HSCEI (72%) as of May 31, 2017. More weight is distributed to new economy sectors, such as I.T. (19%) and consumer discretionary (13%).

Benefiting from its diversification in markets and sectors exposure, the S&P China 500 has demonstrated better risk-adjusted returns (Figure 2). During the period from Dec. 31, 2008, to May 31, 2017, the S&P China 500 generated an annualized return of 10.9% and Sharpe ratio of 0.48; both are the highest among the major China indices.

The S&P China 500 offers more comprehensive market coverage while approximating the sector composition of the broader Chinese equity market, and this makes it a better proxy for the Chinese economy.

[1] Source: Ming Pao, 22 June, 2017. https://news.mingpao.com/pns/dailynews/web_tc/article/20170622/s00004/1498067626316

DISCLAIMERS
The S&P China 500 Index is a product of S&P Dow Jones Indices LLC and/or its affiliates and has been licensed for use by ICBC Credit Suisse Asset Management (International) Co., Ltd. (ICBCCSI), © 2016 S&P Dow Jones Indices LLC, a division of S&P Global. All rights reserved.  S&P, SPDR and S&P 500 are registered trademarks of Standard & Poor’s Financial Services LLC, a division of S&P Global (“S&P”). DOW JONES is a registered trademark of Dow Jones Trademark Holdings LLC (“Dow Jones”). These trademarks together with others have been licensed to S&P Dow Jones Indices LLC. Redistribution, reproduction and/or photocopying in whole or in part are prohibited without written permission. This document does not constitute an offer of services in jurisdictions where S&P Dow Jones Indices LLC, Dow Jones, S&P or their respective affiliates (collectively “S&P Dow Jones Indices”) do not have the necessary licenses. All information provided by S&P Dow Jones Indices is impersonal and not tailored to the needs of any person, entity or group of persons. S&P Dow Jones Indices receives compensation in connection with licensing its indices to third parties. Past performance of an index is not a guarantee of future results. Neither S&P Dow Jones Indices LLC, Dow Jones, S&P, and their respective affiliates (“S&P Dow Jones Indices”) nor their third party licensors make any representation or warranty, express or implied, as to the ability of any index to accurately represent the asset class or market sector that it purports to represent and neither S&P Dow Jones Indices nor their third party licensors shall have any liability for any errors, omissions, or interruptions of any index or the data included therein.
In this document, ICBC Credit Suisse refers to ICBC Credit Suisse Asset Management Company Limited and its subsidiary, ICBC Credit Suisse Asset Management (International) Company Limited (“ICBCCSI”). ICBCCSI is a regulated entity under the Hong Kong Securities and Futures Commission.
No account has been taken of any person’s investment objectives, financial situation or particular needs when preparing this document. This is not an offer to buy or sell, or a solicitation or incitement of offer to buy or sell, any particular security, strategy, investment product or services nor does this constitute investment advice or recommendation.
The views and opinions expressed in this document, which are subject to change without notice, are those of S&P Dow Jones Indices LLC, ICBC Credit Suisse and/or its affiliated companies at the time of publication. While S&P Dow Jones Indices LLC, ICBC Credit Suisse and/or its affiliated companies (collectively as “we” or “us”) believe that the information is correct at the date of this presentation, no warranty of representation is given to this effect and no responsibility can be accepted by us to any intermediaries or end users for any action taken on the basis of this information. Some of the information contained herein including any expression of opinion or forecast has been obtained from or is based on sources believed by us to be reliable as at the date it is made, but is not guaranteed and we do not warrant nor do we accept liability as to adequacy, accuracy, reliability or completeness of such information.  The information is given on the understanding that any person who acts upon it or otherwise changes his or her position in reliance thereon does so entirely at his or her own risk without liability on our part.
This material has not been reviewed by the Hong Kong Securities and Futures Commission.  Issuer of this material: ICBC Credit Suisse Asset Management (International) Company Limited. This material shall be distributed in countries where it is permitted.
INDEX PERFORMANCE DISCLOSURE
The S&P China 500 was launched on August 28, 2015. All information presented prior to an index’s Launch Date is hypothetical (back-tested), not actual performance. The back-test calculations are based on the same methodology that was in effect on the index Launch Date. Complete index methodology details are available at www.spdji.com. Please read S&P Dow Jones Indices LLC’s DISCLAIMERS.

The posts on this blog are opinions, not advice. Please read our Disclaimers.

Most S&P and Dow Jones Islamic Indices Outperform Conventional Benchmarks in 2017

Contributor Image
Michael Orzano

Head of Global Exchanges Product Management

S&P Dow Jones Indices

Most S&P and Dow Jones Shariah-compliant benchmarks outperformed their conventional counterparts year-to-date through June 28, 2017 as Financials – which are largely absent from Islamic indices – have lagged the broader market, and Information Technology and Health Care – which tend to be overweight in Islamic Indices – have been the two top performing sectors so far this year.

Global equity markets added to strong Q1 gains as the Dow Jones Islamic Market World and S&P Global BMI Shariah Indices gained 13.6% and 13.3%, respectively for the year.  Each index outperformed the conventional S&P Global Broad Market Index (BMI) by about 2.5%.  In the U.S., the S&P 500 Shariah gained 10.4% for the year, outperforming the S&P 500 by 1.4%.  Regional Dow Jones Islamic Market benchmarks for Asia-Pacific, Europe and Emerging Markets all beat their conventional counterparts by meaningful margins as well.

Asia-Pacific, Europe and Emerging Markets Lead Global Equity Markets Higher

Gains were broad based across global equity markets.  However, Asia-Pacific, Europe and Emerging Markets have led the way as improved economic prospects and investor sentiment along with strengthening currencies contributed to high double-digit U.S. dollar denominated returns.   Despite recently lagging other major regions, U.S. equity markets have remained strong as the S&P 500 recorded several new all-time highs in 2017 and was up 9.0% year-to-date through June 28.

Weak Oil Prices and Political Uncertainty Weigh on MENA Equities

After a strong finish to 2016, MENA equities have significantly lagged global equity markets in 2017 as falling oil prices and political uncertainty arising from the diplomatic rift between several Arab nations and Qatar weighed on the region’s equity markets.  The S&P Pan Arab Composite Shariah eked out a gain of 1.0% year-to-date through June 27, matching the return of the conventional S&P Pan Arab Composite Shariah.  The S&P Qatar BMI sank 13.2% over the same period with most of the losses concentrated following the June 5 flare up of diplomatic tensions.

The posts on this blog are opinions, not advice. Please read our Disclaimers.

Energy Just Had Its Worst Start in 19 Years

Contributor Image
Jodie Gunzberg

Former Managing Director, Head of U.S. Equities

S&P Dow Jones Indices

Commodities just had their worst start in seven years.  The S&P GSCI Total Return lost 10.2% year-to-date (YTD) ending June 30, 2017, logging its worst first half (H1) performance since the first six months of 2010 when it lost 11.2%.

However, it’s not the bloodbath it may seem to be.  Half, or 12 of the 24 commodities in the index, and three of five sectors were positive YTD through June 2017.  The best and worst single performers came from the same sector, agriculture.  Wheat was the winner, gaining 18.3%, while sugar was the biggest loser, down 29.9%, contributing to an overall sector return of -2.2%.  Although in the first half of 2017, the needle fell just short for agriculture, livestock gained 12.5%, industrial metals were up 8.1% and precious metals were solidly positive 6.9%.

On the other hand, the driver of the poor index performance thus far in 2017 stems from the relatively heavy weight in the energy sector.  The S&P GSCI Energy Total Return  lost 18.8% YTD through June 2017, its worst start in a year since 1998 – almost two decades.

Source: S&P Dow Jones Indices LLC, a division of S&P Global.  The launch date of the S&P GSCI Energy Total Return was May 1, 1991.*

Each single commodity inside the energy sector didn’t just lose in the first half of 2017, but lost double digits.  This is only the second time all six energy commodities lost in the first half of a year (2010 was the first time.  Also, in 1990, 1991 and 1997, before Brent crude and gasoil were included in the index, all the singles were negative in H1.)  Moreover, in the first half of 2017, two of the six energy singles lost more than 20%, the mark that typically denotes a bear market.  This is the fourth time since 1984, two or more energy singles were down over 20% in the first half of a year, with other occurrences in 1990, 1997 and 1998.

The negative returns in H1 2017 of the commodities in the energy sector are worth noting individually —  Brent crude -17.4%, (WTI) crude oil -18.8%, gasoil -15.8%, heating oil -16.5%, natural gas -26.4% and unleaded gasoline – 22.3% — since without them, commodities were positive in the first half.  The S&P GSCI Non Energy Total Return gained 4.1% in the first half of 2017, outperforming the S&P GSCI Energy Total Return by 22.9%, the most in a first half in 27 years or since 1990.

Source: S&P Dow Jones Indices LLC, a division of S&P Global.  The launch date of the S&P GSCI Energy was May 1, 1991. The launch date of the S&P GSCI Non Energy was May 1, 1991.*

In two recent notes, the reasons for this split in performance were discussed, with this note focusing on energy and easy to read charts on contango and backwardation.  The term structure is important since it reflects the storage costs that determine returns from rolling.  Negative roll returns measure the costs from excess inventory that have plagued energy investors beginning in Nov 2014.  One potentially positive sign is that unleaded gasoline, the most backwardated commodity of all, gained a roll return of 43 basis points in June that has ended its long contango streak from Dec. 2016.  Another possibly optimistic sign in June from energy is that for the first month since Nov. 2016, the roll yield loss was less for WTI than for Brent.   (WTI) crude oil lost 50 basis points in June versus the roll yield loss of 72 basis points in the month for Brent crude.  This shift in roll return may reflect declining U.S. inventory cost relative to the international market, pointing in the right direction toward the probable key factor in the oil re-balance.

*All information presented prior to the index launch date is back-tested. Back-tested performance is not actual performance, but is hypothetical. The back-test calculations are based on the same methodology that was in effect when the index was officially launched. Past performance is not an indication or guarantee of future results. Please see the Performance Disclosure at http://www.spindices.com/regulatory-affairs-disclaimers/ for more information regarding the inherent limitations associated with back-tested performance.


The posts on this blog are opinions, not advice. Please read our Disclaimers.

Green Bonds: Addressing Solvency II Benchmarking Requirements

Contributor Image
Dennis Badlyans

Former Associate Director, Global Research & Design

S&P Dow Jones Indices

Solvency II is the new region-wide supervisory framework for insurance and reinsurance companies operating in the European Union.  The new regime includes three pillars, calculation of capital reserves, management of risk and governance, and reporting to the national supervisory authority.  Moving to a risk-based approach in calculating solvency capital requirements (SCR) will require reassessment of investment choice.  Risky assets that will require a higher charge may become less appealing vis-à-vis a low risk asset, despite the expectation of better performance.

It falls on insurers to classify assets; certain types are well defined while some types need to be assessed against an extensive list of criteria, including qualitative factors.  In calculating SCR, insurers may follow the standard formula, develop an internal model subject to supervisory approval, or use a combination of the two.  Focusing on the standard formula approach, insurers will determine the level of instantaneous shocks prescribed for each asset to aggregate into a total capital requirement.

Cash-flow risk, issuer/credit risk, and duration risk are among the key factors in determining the prescribed shock schedule.  For example, a government bond issued by an EU member state in an EU member currency has a risk weight of 0%, while a B+ rated, 25-year duration corporate bond will have a risk weight of 66%.  In particular, exposure to member state central government debt, certain multilateral development banks, and certain international organizations, as well as debt guaranteed by member states’ central government, are assigned a risk weight of 0% (article 180, paragraph 2 of Regulation (EU) No 2015/35).

Looking at the types of securities that can potentially qualify for lower capital charges, green bonds stand out as one possible candidate for those requiring 0% capital charge.  Multilateral development banks and international organizations are among the active issuers in the green bond market.  Additionally, sovereign issuers such as Poland and France have initiated issuance in the green bond market.  Hence, an index of qualifying green bond securities could serve the industry as a 0% capital charge benchmark for European insurers and reinsurers.

We can highlight a hypothetical basket of qualifying securities by screening for these specific issuers within the S&P Green Bond Select Index, excluding U.S. municipals.  The screen produces a hypothetical portfolio of 42 green bonds, representing 31.9% of the S&P Green Bond Select Index market value (Exhibit 1).

The posts on this blog are opinions, not advice. Please read our Disclaimers.