Get Indexology® Blog updates via email.

In This List

Asian Fixed Income: From Implicit Guarantees to Bond Defaults

No News, and No Implications

Drawdown Analysis of Low Volatility Indices

Why Companies and Investors Need to Value Water Differently

Next Generation Retirement Investing

Asian Fixed Income: From Implicit Guarantees to Bond Defaults

Contributor Image
Michele Leung

Former Director, Fixed Income Indices

S&P Dow Jones Indices

Chinese authorities will allow market participants to buy onshore bonds through transactions carried out in Hong Kong, which will further broaden foreign access to China’s onshore bond market. While no additional details have been provided, a “bond connect” scheme that provides cross-border cash bond trading is anticipated by market participants.

Despite currency volatilities, China bonds offer better yields and diversification benefits. However, foreign investors are concerned with the potential credit risk.  Besides the non-parallel rating systems between local and the international standards, the implicit government guarantees prevented bond defaults, which had made it difficult to analyze the true underlying credit risk.

However, following the first bond default in 2014, the number of bond defaults has been accelerating, including those of state-owned enterprises. According to WIND data, over 60 bonds defaulted in 2016, with the affected sectors including land development, mining, steel-iron, and oil & gas.  The biggest default in 2016 was from China City Construction, a Chinese construction and development firm, with a collective defaulted amount of CNY 8.55 billion.  In the first two months of 2017, bond defaults amounted to CNY 4.1 billion from Dongbei Special Steel, Dalian Machine Tool, and Inner Mongolia Berun.

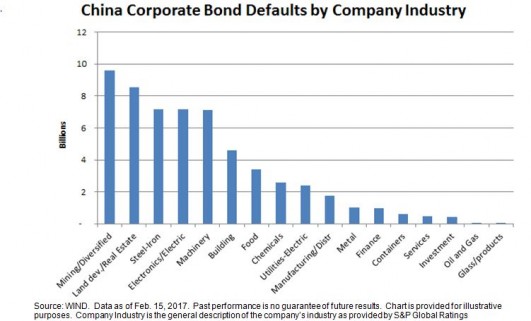
From 2014 to February 2017, China recorded a total of CNY 58 billion of bond defaults, which is equivalent to 0.11% of the current overall market value, as tracked by the S&P China Bond Index. The top two industries that had the highest default amounts were mining/diversified and landing development/real estate, reflecting the sharp slowdown in Chinese manufacturing and construction.

The defaults are perceived to be healthy for the long-term development of China’s onshore bond market. In the search for higher-quality corporate bonds, we adopted a two-tier screening approach in our index design and launched the S&P China High Quality Corporate Bond 3-7 Year Index. As per the index methodology, issuers must first be investment-grade rated by at least one of the international rating agencies, and then securities must be rated ‘AAA’ by at least one of the local Chinese rating agencies.

Exhibit 1: China Corporate Bond Defaults by Company Industry (Total Par Amount)


The posts on this blog are opinions, not advice. Please read our Disclaimers.

No News, and No Implications

Contributor Image
Craig Lazzara

Former Managing Director, Index Investment Strategy

S&P Dow Jones Indices

This morning’s Wall Street Journal reported, rather breathlessly, that “U.S. bond yields are topping a key measure of the dividends that large U.S. companies pay—a shift that has broad implications for investors….”  The headline was triggered by the observation that the 2.50% “yield on the 10-year U.S. Treasury note…exceeded the 1.91% dividend yield on the S&P 500.”

Does this fact have important implications? On the contrary, we’d argue that this isn’t news, and that it tells us nothing about the market’s future direction.  For historical context consider the chart below:

In September 1958, the yield on the 10-year Treasury note rose above that of the S&P 500, a condition which continued unabated for the next 50 years.  Stock yields rose above bond yields briefly at the end of 2008, but have remained below bond rates for most of the time since then.  In other words, for the vast majority of recent history, the yield on bonds has exceeded the yield on stocks.

Does the current upward move in interest rates pose “a threat” to the stock market, as the Journal suggests?  The historical evidence here is ambiguous; since 1991, the average return for the S&P 500 has been higher in months when interest rates rose than in months when rates fell.  There is clearly no concrete relationship between the direction of rates and the direction of the stock market, as the chart below makes clear:

It’s certainly possible that increased competition from higher bond rates will cause weakness in the equity market.  It’s equally possible that the economic strength which is producing higher bond yields will also sustain earnings and stock prices.  In either event, the news that bonds yield more than stocks hardly qualifies as news at all.

The posts on this blog are opinions, not advice. Please read our Disclaimers.

Drawdown Analysis of Low Volatility Indices

Contributor Image
Phillip Brzenk

Managing Director, Global Head of Multi-Asset Indices

S&P Dow Jones Indices

One of the objectives of low volatility strategies is to provide higher risk-adjusted returns than their respective benchmarks over the long run, primarily by reducing drawdowns during market downturns.  In the U.S. market, both the S&P 500® Low Volatility Index and the S&P 500 Minimum Volatility Index have shown outperformance over the S&P 500, not just on a risk-adjusted basis, but also in absolute terms (see Exhibit 4 of Inside Low Volatility Indices).  To understand how the volatility strategies performed in the most significant down markets, we look at the three largest drawdowns of the S&P 500 since 1990:

In all three drawdown periods, the low-risk strategies outperformed the benchmark.  In the financial crisis (2007-2009), the S&P 500 Low Volatility Index outperformed the S&P 500 by over 15% and the S&P 500 Minimum Volatility Index outperformed by more than 6%.  The return differential during the tech bust (2000-2002) was more extreme, with the minimum volatility outperforming by 30% and the low volatility index outperforming by 50%.  During the Russian currency crisis (1998), the S&P 500 dropped 19% in under two months, and the low-risk strategies were again able to limit losses.

Did the low-risk indices outperform during the market downturns for the same reasons, or did the methodology differences (as outlined in a previous post) lead to different sources of excess return?  A common approach to analyzing this is to run a sector-based performance attribution, which breaks down the total excess return of a portfolio versus a benchmark between an allocation effect and a selection (+ interaction) effect.  The allocation effect will show the effect of over- or underweighting a sector relative to a benchmark, while the selection effect will show the effect of over- or underweighting individual securities within a sector relative to the benchmark.  The sector-based attribution results for the low-risk strategies during each of the three largest drawdowns of the S&P 500 are shown in the following exhibits, with the sector that had the highest total effect highlighted for each index.

During the largest drawdown, the financials sector was the largest contributor to excess return for both volatility strategies, with a total effect of 3.91% in the S&P 500 Minimum Volatility Index and 7.04% in the S&P 500 Low Volatility Index.  While both outperformed, the allocation and selection effect figures show contrasting reasons for the outperformance.  In the minimum volatility index, the allocation effect for financials was negative (-1.50%), as the financials sector in the S&P 500 underperformed, and the minimum volatility index had an average sector weight higher than the benchmark.  However, it was successful in selecting or weighting securities within the sector (selection effect of 5.41).  In the low volatility index, the financials sector’s weight was significantly reduced during the period, with an average weight of 9.23% lower than the S&P 500.  The underweight led to an allocation effect of 4.86%, while the selection effect contributed 2.17%.

The second-largest drawdown (tech bust) highlights the methodological differences for sector diversification.  Both low volatility strategies allocated away from information technology, but the minimum volatility index sector constraints (±5% relative to the benchmark at rebalancing), whereas the low volatility index can move completely out of a sector.  This occurred for the information technology sector in the low volatility index, which lead to a total effect of 18.39%.

What is evident in examining the drawdown periods is that the majority of outperformance can come from different effects for the two low-risk indices.  The selection + interaction effects drove most of the outperformance for the minimum volatility index, while the allocation effect drove the majority of the outperformance for the low volatility index.

Our related research paper, Inside Low Volatility Indices, expands on the comparison between the two low-risk strategies.

The posts on this blog are opinions, not advice. Please read our Disclaimers.

Why Companies and Investors Need to Value Water Differently

Contributor Image
Libby Bernick

Global Head of Corporate Business

Trucost, part of S&P Dow Jones Indices

March 22, 2017, is World Water Day, the U.N.’s annual bid to raise awareness about the water crisis.  Climate change, pollution, and overconsumption are making fresh water an increasingly scarce resource.  Worldwide, 663 million people currently have no access to clean water.  By 2030, it is predicted that there will be a 40% shortfall in water supplies.[1]

Good quality water is essential to the production of nearly everything, from the food we eat to the clothes we wear.  Trucost research found that in 2016, listed companies reported exposure to water risks totaling almost USD 126 billion, due to higher operating costs associated with declining water quality and water supply disruption.  However, when taking into account the thousands of listed companies that do not disclose on water dependency, the risk could be up to USD 439 billion.

The main problem is the lack of an appropriate market price for water—one that reflects its full economic, social, and environmental value.  In most regions, there is little correlation between the price paid for water and its availability or quality.  In many places, water is cheapest where it is most scarce.  Weak regulation means water basins can be polluted by effluent discharges.

As good quality water gets scarcer, companies become increasingly exposed to water-related risks.  Market participants are also exposed to these risks through equity holdings, corporate loans, and project finance in water-intensive sectors.

Analysis by Trucost shows that if the full costs of water scarcity and pollution had to be absorbed by companies as a result of reduced water allocations, higher conditioning costs, or tougher effluent discharge requirements, average profits could fall by 18% in the chemical sector, 44% in the utilities sectors, and a massive 116% in the food and beverage sector (see Exhibit 1).

To understand and manage these risks, companies need better data on where water risks are in their global operations.  Analytical tools, such as Aqueduct by the World Resources Institute,[2] provide a way to screen locations where water is scarce.

Ecolab’s Water Risk Monetizer[3]—powered by Trucost and Microsoft—extends the insights from the Aqueduct tool and puts a monetary value on water risks, including scarcity and quality, so that they can be factored alongside operational costs and revenue forecasts.  The Water Risk Monetizer also allows users to calculate asset-level avoided risk and return on investment of water improvement projects, illustrating how businesses should prioritize investments, engage with other water users, and monitor local water conditions.

Market participants can manage risk by encouraging better corporate disclosure of water-related financial risks.  This was recognized in draft recommendations published by the Financial Stability Board’s Task Force on Climate-related Disclosures[4] in December 2016, which said that all organizations, from companies to financial institutions, should disclose information on their governance, strategy, risk management, metrics, and targets for managing climate risks, including water scarcity.  Enhanced disclosure on water will accelerate mainstream green finance as more relevant information reaches the market.

The first step is for companies and market participants to understand the water risk exposure of operations, suppliers, assets, and investments so they can build resilience against increasing water scarcity and pollution impacts, identify opportunities from water stewardship solutions, and engage with stakeholders to drive change through the market.

[1]   http://unesdoc.unesco.org/images/0023/002318/231823E.pdf

[2]   http://www.wri.org/our-work/project/aqueduct

[3]   http://waterriskmonetizer.com/

[4]   https://www.fsb-tcfd.org/publications/recommendations-report/


The posts on this blog are opinions, not advice. Please read our Disclaimers.

Next Generation Retirement Investing

Contributor Image
Massi DeSantis, PhD

Vice President

Dimensional Fund Advisors

For many plan participants, the goal of a retirement account is to provide a steady stream of income that will sustain their standard of living in retirement. Therefore, participants need a framework that aligns the management of their savings with their retirement income goal. This framework has three related components:

  1. Risk management that addresses the risks that are relevant to retirement income.
  2. Asset allocation that balances the tradeoff between asset growth and income risk management.
  3. Meaningful communication that enables participants to monitor performance in income units.

Risk Management
The first consideration regarding risk management is how long you expect participants’ accumulated savings to support their consumption in retirement. In the US, the average life expectancy of a 65-year-old person is 85 years.[1] To account for uncertainty about life expectancy, we can add a five-year buffer to the average retirement horizon, resulting in a 25-year expected withdrawal period.

The next step is to identify the key drivers of income uncertainty over that withdrawal period. Retirement income uncertainty is driven by market risk (uncertainty of future stock and bond returns), interest rate risk, and inflation risk. These risks can be reduced by computing the duration of the retirement income stream and allocating to a portfolio of inflation-protected securities that are duration-matched to the planned retirement horizon. This is the basis of the risk management strategy of Dimensional’s retirement solutions and the S&P Shift to Retirement Income and Decumulation (STRIDE) Index Series. This framework also helps to manage sequencing risk, as the level of retirement income that can be supported by the allocation to risk management assets is not very sensitive to market risk, interest rate risk, or inflation risk.

Asset Allocation
Having identified an appropriate risk management strategy, the asset allocation question then becomes a tradeoff between allocating to growth assets vs. risk management assets. The higher the allocation to risk management assets, the lower the expected volatility of retirement income. In launching the S&P STRIDE Indices, S&P Dow Jones Indices has developed a benchmark for investment solutions that seek to grow the value of participants’ savings while managing retirement income uncertainty. This entails a focus on asset growth early in participants’ lifecycles with a transition to an income-focused strategy over time. As participants transition into retirement, the majority of their assets are invested in inflation-protected government securities matched to their retirement horizon. This liquid investment strategy can be used by participants who desire periodic withdrawals in retirement.

Meaningful Communication
A retirement solution should also allow participants (and their plan sponsors) to monitor progress toward a retirement income goal. This can be achieved through information that translates the purchasing power of participants’ account balances in terms of estimated retirement income. The S&P STRIDE Indices include a monthly cost of retirement income called the Generalized Retirement Income Liability (GRIL)[2] for each retirement cohort, which can be used to translate account balances to estimated retirement income.

If the GRIL goes up (down), generating a given level of income becomes more (less) costly, and the purchasing power of a given level of savings goes down (up). Because of the risk management framework in the S&P STRIDE Indices, uncertainty about participants’ future income is reduced over time so that communication in income units can be more meaningful. We believe the right risk management helps provide clarity about expected retirement outcomes and empowers participants to make better retirement decisions.

[1] Source: Social Security Administration: Calculators – Life Expectancy. The age of 85 is computed by averaging the male life expectancy and the female life expectancy for people turning 65 in 2017.
[2] GRIL is defined as the present value of $1 of annual inflation-adjusted income over 25 years starting at the target date. The interest rates used to discount these future hypothetical cash flows to the present are derived from the current US TIPS curve.

The S&P STRIDE INDEX is a product of S&P Dow Jones Indices LLC or its affiliates (“SPDJI”) and has been licensed for use by Dimensional Fund Advisors LP (“Dimensional”). Standard & Poor’s® and S&P® are registered trademarks of Standard & Poor’s Financial Services LLC (“S&P”); Dow Jones® is a registered trademark of Dow Jones Trademark Holdings LLC (“Dow Jones”); these trademarks have been licensed for use by SPDJI and sublicensed for certain purposes by Dimensional. Dimensional’s Products, as defined by Dimensional from time to time, are not sponsored, endorsed, sold, or promoted by SPDJI, S&P, Dow Jones, or their respective affiliates, and none of such parties make any representation regarding the advisability of investing in such products nor do they have any liability for any errors, omissions, or interruptions of the S&P STRIDE Index.
Dimensional Fund Advisors LP receives compensation from S&P Dow Jones Indices in connection with licensing rights to the S&P STRIDE Indices. It is not possible to invest in an index.

The posts on this blog are opinions, not advice. Please read our Disclaimers.