In our May dispersion dashboard, we note that “If there is ever such thing as a “stock-pickers’ market”, then the month of May 2017 – at least in some regions – might be the closest approximation we have seen for a decade.”
The subject of what, exactly a “stock-pickers’ market” might look like, and how we would know when we are in one, has been a topic of extensive study and regular commentary. First, we should explain what we mean by a “stock pickers’ market”.
One definition of a “stock pickers’ market” is a tailwind for concentrated bets, even if they are made by the unskilled investor. Such an environment can be identified by the performance of equal-weight indices, since – if equal weight outperforms the cap-weighted benchmark then, by definition, the average stock outperforms. The fortunes of concentrated portfolios, such as those maintained by a traditional stock-picker, are also impacted by the level of market skewness, among other factors of importance.
Alternatively, a “stock-pickers’ market” can mean that those stock-pickers with genuine skill (or luck) are particularly distinguished from those with less skill or less luck. This is quite a different scenario to the one in which the “average” stock-picker is more likely to outperform – and with different characteristics:
- First, it requires high dispersion: the difference between winners and losers should offer significant rewards to those who make the right calls.
- Second, it requires low correlations between different stocks: the stock picker prefers his picks to reflect the that characteristics made them more attractive than their peers in the first place, as opposed to shared drivers. This is different to high dispersion, although they often coincide.
- Third and finally, one would hope for low market volatility: the stock picker who outperforms the market, yet is whipped around along with it, has not only a more stressful experience (or at least his clients do), but also is provided with a less clear signal of his skills.
The charts below show the levels of dispersion, correlation and volatility recorded in the month of May in several of the major markets covered by S&P Dow Jones Indices. The charts place each measurement in their historical context: the level for the most recent month is the coloured dot; the light grey bars represent the middle 90% of all observations in the past decade, while the dark grey bars represent the middle 50%. A single black line represents the historical median:
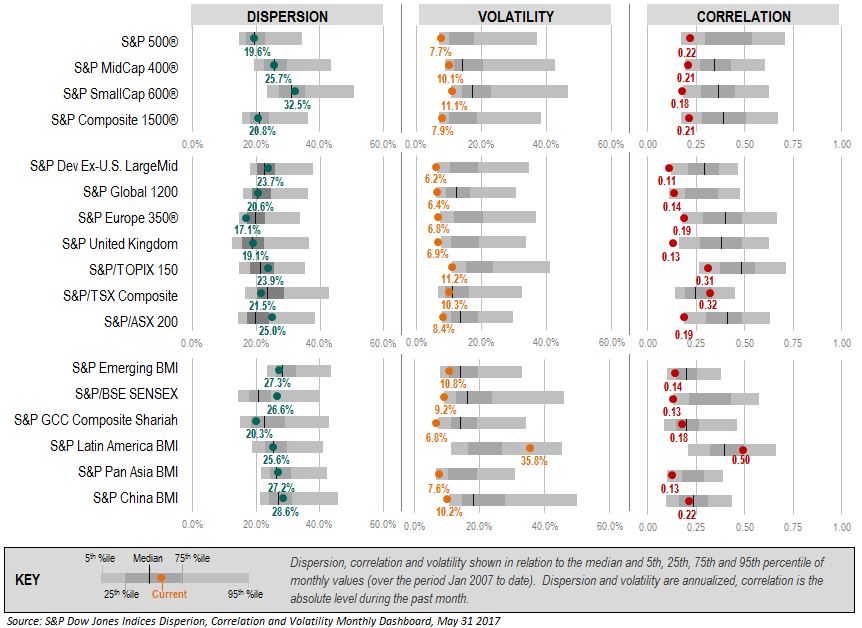
In several of these regions, most notably in countries such as Australia and Japan, and in market segments such as U.S. small caps, as well as across the broad-based S&P Developed ex-U.S. LargeMid BMI universe, benchmark volatility and average stock correlations stand at or near record lows, while dispersion has risen above average.
Raising the stakes, May was also a month in which there were headwinds for the unlucky, and the unskilled. As reported in our standard dashboards, equal-weight indices under-performed in the U.S. and in Europe, while smaller stocks outperformed the very largest more generally across Asia.
What does this mean for active mangers? The month of May, 2017 provided an example of market circumstances favouring the skillful or lucky stock-picker, but not the average. And while one swallow does not make a summer, if such an environment should persist through the rest of the year, then there will be fewer excuses for poor performance at the end of it.
The posts on this blog are opinions, not advice. Please read our Disclaimers.