Get Indexology® Blog updates via email.

In This List

A long time coming: Real estate moves out from under the shadow of financials – Part 2

Millennials and the Investment Shift

An Index with a Scary Name and a Serious Return

Water Risk for Business – Three Key Questions

Most Major Islamic Indices Have Outperformed Conventional Benchmarks in 2016

A long time coming: Real estate moves out from under the shadow of financials – Part 2

Contributor Image
Nick Kalivas

Senior Equity Product Strategist

Invesco

Interest rates have influenced the performance of REITs relative to bank shares

Interest rates have a strong influence on equity REIT performance, as evidenced by the graphic below, which displays the relationship between the 10-year Treasury yield and the relative performance of the S&P 500 Banks Index to the S&P 500 Real Estate Investment Trusts REITS Industry Index.  Note that banks have generally outpaced REITs when interest rates are rising, and have tended to lag when interest rates are declining. This relationship can be most clearly seen after the Great Recession (early 2009).

This pattern of relative performance may be linked to improved bank profitability in a high or rising interest rate environment and the desire of investors to own REITs for yield purposes in a falling or low rate environment. In a sense, REITs become a bond substitute. The breakout of REITs from the financials sector may better focus investors on the relationship between banks and REITs.

capture

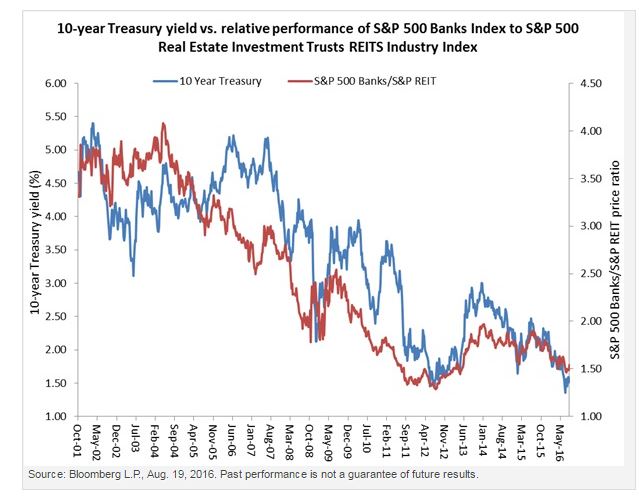
This chart also indicates that the price of bank stocks have been lagging the price of REITs for more than a decade. The price ratio of the S&P 500 Real Estate Investment Trusts REITS Industry Index to the S&P 500 Banks Index was over 4.0 in 2004 and has slumped to 1.5, although it is off the low seen in 2012.1

A potential rise in rates could have ramifications for bank stocks, REITs

Banks may look cheap relative to REITs right now, but a catalyst will likely be needed to reverse that trend. Higher interest rates would be one such catalyst. Predicting the direction of the 10-year Treasury yield is always difficult. However, the pace of economic growth, the direction of inflation and interest rates overseas may help investors interpret the interest rate landscape and outlook for the relative performance of bank shares to REITs. Let’s review the factors:

  • Economic growth has found firmer footing of late due to a more favorable inventory cycle (a decline in the growth rate of the inventory-to-sales ratio) and reduced headwinds from foreign exchange, as the US dollar has traded more sideways over the past year. Industrial production was down 0.5% year over year in July, but up from a trough of -2.0% in March.1 To put the current level of industrial production into context, industrial production peaked at 3.9% in July 2014.1 Movement of production into firmly positive growth territory could be a catalyst that lifts yields.
  • Inflation has shown signs of slow acceleration. The consumer price index less food and energy has risen to 2.2% on a year-over-year basis from its February 2014 low of 1.6%.1 However, it has not been able to breach the post-recession high of 2.3% established in April 2012 and February 2016.1 A rally in inflation over 2.3% could put upward pressure on the 10-year Treasury yield and focus the Treasury market more closely on inflation.
  • Lastly, yields remain negative in Germany and Japan and make the current Treasury yield just below 1.60% look attractive. A normalization of rates in Germany and Japan could lead to higher 10-year Treasury yields.

———————————————————————————

Important information
Correlation is the degree to which two investments have historically moved in relation to each other.
Dividend yield is the amount of dividends paid over the past year divided by a company’s share price.
Price ratio compares the price of one security (or basket or securities) to another security (or basket of securities). In this case, the prices of two indexes are compared.
A real estate investment trust (REIT) is a closed-end investment company that owns income-producing real estate.
Relative performance refers to the performance of an asset or investment relative to another asset, investment or benchmark.
The consumer price index (CPI) measures change in consumer prices as determined by the US Bureau of Labor Statistics.
The CBOE Volatility Index® (VIX®) is a key measure of market expectations of near-term volatility conveyed by S&P 500 stock index option prices. VIX is the ticker symbol for the Chicago Board Options
Exchange (CBOE) Volatility Index, which shows the market’s expectation of 30-day volatility.
The Dow Jones U.S. Mortgage REITs Index comprises real estate investment trusts, corporations or listed property trusts that are directly involved in lending money to real estate owners.
The S&P 500 Real Estate Investment Trusts REITS Industry Index defines and measures the investable universe of publicly traded real estate investment trusts domiciled in the United States.
The S&P 500 Utilities Sector Index is an unmanaged index considered representative of the utilities market.
The S&P 500 Financials Index comprises those companies included in the S&P 500 that are classified as members of the GICS® financials sector.
The S&P Banks Index comprises stocks in the S&P Total Market Index that are classified in the GICS asset management & custody banks, diversified banks, regional banks, other diversified financial services and thrifts & mortgage finance sub-industries.
The S&P Insurance Select Industry Index comprises stocks in the S&P Total Market Index that are classified in the GICS insurance brokers, life & health insurance, multi-line insurance, property and casualty insurance and reinsurance sub-industries.
The S&P 500® Index is an unmanaged index considered representative of the US stock market.
The S&P 500 Diversified Financials Industry Group Index is a capitalization-weighted index that is considered representative of the diversified financials industry group.
An investor cannot invest directly in an index.
Past performance is no guarantee of future results.
There are risks involved with investing in ETFs, including possible loss of money. Shares are not actively managed and are subject to risks similar to those of stocks, including those regarding short selling and margin maintenance requirements. Ordinary brokerage commissions apply. The Fund’s return may not match the return of the Underlying Index. The Fund is subject to certain other risks. Please see the current prospectus for more information regarding the risk associated with an investment in the Fund.
Investments focused in a particular industry or sector are subject to greater risk and are more greatly impacted by market volatility, than more diversified investments.
Investments in real estate related instruments may be affected by economic, legal, or environmental factors that affect property values, rents or occupancies of real estate. Real estate companies, including REITs or similar structures, tend to be small and mid-cap companies and their shares may be more volatile and less liquid.
Treasury securities are backed by the full faith and credit of the US government as to the timely payment of principal and interest.
Shares are not individually redeemable and owners of the Shares may acquire those Shares from the Fund and tender those Shares for redemption to the Fund in Creation Unit aggregations only, typically consisting of 50,000, 75,000, 100,000 or 200,000 Shares.
The information provided is for educational purposes only and does not constitute a recommendation of the suitability of any investment strategy for a particular investor. Invesco does not provide tax advice. The tax information contained herein is general and is not exhaustive by nature. Federal and state tax laws are complex and constantly changing. Investors should always consult their own legal or tax professional for information concerning their individual situation. The opinions expressed are those of the authors, are based on current market conditions and are subject to change without notice. These opinions may differ from those of other Invesco investment professionals.
NOT FDIC INSURED
 MAY LOSE VALUE
 NO BANK GUARANTEE
All data provided by Invesco unless otherwise noted.
Invesco Distributors, Inc. is the US distributor for Invesco Ltd.’s retail products and collective trust funds. Invesco Advisers, Inc. and other affiliated investment advisers mentioned provide investment advisory services and do not sell securities. Invesco Unit Investment Trusts are distributed by the sponsor, Invesco Capital Markets, Inc., and broker-dealers including Invesco Distributors, Inc. Each entity is an indirect, wholly owned subsidiary of Invesco Ltd. PowerShares® is a registered trademark of Invesco PowerShares Capital Management LLC, investment adviser. Invesco PowerShares Capital Management LLC (Invesco PowerShares) and Invesco Distributors, Inc., ETF distributor, are indirect, wholly owned subsidiaries of Invesco Ltd.
©2016 Invesco Ltd. All rights reserved.

The posts on this blog are opinions, not advice. Please read our Disclaimers.

Millennials and the Investment Shift

Contributor Image
Emily Ulrich

Former Senior Product Manager, ESG Indices

S&P Dow Jones Indices

Lately, it seems like millennials have been everywhere: in the news, peppered throughout pop culture, and a serious topic of debate among the investment and financial landscape.

So—who are the millennials and why do they matter?  What impact will their wealth and world views have on sustainable investing?

“Millennials” refers to the generation born between 1980 and 2000.  They are crucial to shaping the future of global investment landscape, as they are expected to compose more than 50% of the workforce by 2020.[1]  It is also estimated that over the next several years, they will be on the receiving end of a generational transfer of personal wealth of USD 59 million.[2]

So what can we expect them to do with that wealth?

We know that millennials have grown up in an economic recession and this has had an impact on both their trust in the economy (and investing in particular) and their loyalty to employers.

In a 2008 survey of millennials, [3] PWC found that, of those surveyed, 75% believed they would have two to five employers, whereas in 2011, that number dropped to 54% and more than 25% reported that they expect to have six employers or more, compare with only 10% who felt the same in 2008 – thereby revealing the nomadic traits of the workplace. This decrease in loyalty may also spread to financial institutions. In a 2015 survey, LinkedIn and Ipsos found that 57% of millennials would be open to try financial offerings from non-financial brands.[4]

In a 2011 survey of millennials, PWC found that, of those surveyed, 54% expected to have two to five employers in their lifetime, whereas, in 2008, 75% believed they would have two to five employers.  In the 2011 survey, more than 25% reported that they expect to have six employers or more, compared with only 10 % who felt the same in 2008—this reveals the nomadic traits of the new generation in the workplace.

Both PWC and LinkedIn also found that millennials care deeply about their personal values and morals.  This is crucial to the future of sustainable investing.  Millennials, who value their moral compasses so highly, will also care deeply about where their money goes.  Sustainable investing is the perfect solution to address many of those concerns. It is incredibly important for financial providers to recognize these concerns, particularly as millennials have signaled an openness toward non-traditional financial offerings.

In the current passive investment space, market participants can choose from a wide range of indices that relate to personal values, including human capital, climate change mitigation, long-termism, faith based, and social responsibility.  Looking toward the future, millennials could be expected to be key drivers of sustainable investment.

[1] https://www.pwc.com/m1/en/services/consulting/documents/millennials-at-work.pdf

[2] https://www.bc.edu/content/dam/files/research_sites/cwp/pdf/A%20Golden%20Age%20of%20Philanthropy%20Still%20Bekons.pdf

[3] http://www.pwc.com/gx/en/issues/talent/future-of-work/download.html

[4] https://business.linkedin.com/content/dam/business/marketing-solutions/global/en_US/campaigns/pdfs/affluent-millennial-research-whitepaper-eng-us.pdf


The posts on this blog are opinions, not advice. Please read our Disclaimers.

An Index with a Scary Name and a Serious Return

Contributor Image
Reid Steadman

Former Managing Director, Global Head of ESG & Innovation

S&P Dow Jones Indices

Passive investors do not buy and sell single securities, but they are often active in another way, in their search for indices that provide compelling return profiles. This is why I’m befuddled that a certain index – which is up 300% over the past 5 years – attracts so little attention.

I have a few theories why this is so. Here’s the simplest one: this index’s name convinces people that it is beyond comprehension. This is the name:

S&P 500 VIX Mid-Term Futures Inverse Daily Index

Now that you’ve digested this, here is the case, in one chart, for studying this index:

chart-1-ziv

Despite this impressive record relative to the S&P 500, only $74 million tracks this index, all in a single exchange-traded note (“ETN”) launched in 2010. What gives?

The Strategy
Aside from the surface-level problem of the index name, another issue that inhibits use of this index is that it covers an asset class, volatility, which is out of many investors’ comfort zone. But the basics of this index are simpler than you would expect.

The essence of the S&P 500 VIX Mid-Term Futures Inverse Daily Index is that it takes a short position in futures contracts based on the CBOE Volatility Index, better known as VIX. Because investors buy VIX futures contracts to protect their portfolios against steep market declines, taking the other side of this transaction and shorting VIX futures is essentially selling insurance.

The economics of the car or home insurance markets are similar to those of the VIX futures market. Buyers of VIX futures contracts pay a premium – in the form of a roll cost – and sellers of VIX futures contracts collect this. Insurance providers and VIX futures sellers lose big time when disaster hits, but the proceeds accumulated during periods of calm can make systematic selling profitable, as the chart above shows.

The S&P 500 VIX Mid-Term Futures Inverse Daily Index shorts a specific set of futures, those that are four to seven months from expiration. This is where the “Mid-Term” comes from. An investor selling VIX futures is betting that the price of market insurance will not spike up in the months ahead, negating gains.

Yes, Volatile, but Less Volatile
Another reason investors might shy away from the S&P 500 VIX Mid-Term Futures Inverse Daily Index is that it is volatile. Though it is true that this index is more volatile than the S&P 500, this index is much less volatile than a similar index, the S&P 500 VIX Short-Term Futures Inverse Daily Index, which has over $500 million tracking it in an ETN that trades on average 24.5 million shares a day.

The chart below shows the index histories for the Mid-Term and Short-Term indices since they became investable when ETNs launched in 2010. These indices have achieved close to the same return in this time frame, but the S&P 500 VIX Mid-Term Futures Inverse Daily Index took a smoother path.
chart-2-ziv

Investors Should Care About This Index
So the index name and methodology provide an initial scare, but there is a good reason to settle down and take this index seriously. Over certain periods, the S&P 500 VIX Mid-Tem Futures Inverse Daily Index has allowed investors to collect a rather rich insurer’s premium. It is indeed subject to serious drawdowns, as the second chart in this post shows, but those declines are less severe than users of the more popular Short-Term Index experience. Because of this, the Mid-Term Index may be ideal for investors not seeking to buy or sell at every turn in the market, but those wanting to profit from longer-term trends in volatility.

The posts on this blog are opinions, not advice. Please read our Disclaimers.

Water Risk for Business – Three Key Questions

Contributor Image
Neil McIndoe

Head of Environmental Finance

Trucost

Water crises are the top societal global risk in terms of impact, according to The World Economic Forum’s Global Risk Report 2016.

There is of course no lack of water; the risk is around availability of fresh water which constitutes just 2.5% of the world’s water. This has broadly been the case for millennia – what’s new is the enormous growth in demand for fresh water.

Rising water demand is largely influenced by population growth and its food and energy needs. The world population of 7 billion today is projected to grow to over 10 billion by 2050 and the United Nations predicts an associated 55% rise in global water demand.

Companies need to answer three questions to ensure they have resilient business models:

  1. How dependent is my business on water throughout the value chain?
  2. Are any of these dependencies in water stressed areas?
  3. Do I make sufficient profit from my local use of water to compete with other users?

Water Dependency

Companies need to understand their dependency on water throughout the value chain. Many companies – not unnaturally – focus on their own direct use of water. Fig 1 represents the water footprint of a fruit juice company along the value chain. Previously, the majority of their water initiatives were in the bottling process, which accounted for just 3% of water use. Once this was understood, a number of different mitigation strategies were deployed to improve resilience where it most mattered in the fruit growing stage, including long term contracts with farmers in areas of more robust water supply and joint investment in water irrigation efficiency.

capture

Water Stress 

Water stress is not simply a consideration for companies operating in the world’s hotter countries. The UK is not often thought of as an area for concern but a 2013 government study classified 9 out of the 24 water company areas as having “serious” water stress.

This stress can translate into business risks in two main ways. Firstly, there is simply insufficient water for the business to operate, or to operate at its optimum capacity. The mining industry is one that frequently has this issue. But it is the second that will increasingly become a standard business concern – that of cost.

Water /Profit

While water has historically been plentiful and inexpensive, this is not the future outlook. Increasing competition for a scarce resource will require companies to make sufficiently good economic use of water to enable them to secure supplies as costs rise.

In Australia’s Murray River basin, where water trading has taken place for a number of years, we have seen water rights sold off by agriculture concerns to other sectors such as mining who use the water more profitably.

To understand and mitigate future risk for both themselves and investors, companies need to understand where in their value chains water presents the biggest risk, alongside competition for water in the river basins in which they operate.

The posts on this blog are opinions, not advice. Please read our Disclaimers.

Most Major Islamic Indices Have Outperformed Conventional Benchmarks in 2016

Contributor Image
Michael Orzano

Head of Global Exchanges Product Management

S&P Dow Jones Indices

Most S&P Dow Jones Indices Shariah-compliant benchmarks outperformed their conventional counterparts through the end of September 2016, with financials—which is largely absent from Islamic indices—significantly underperforming and information technology—which tends to be overweight in Islamic indices—performing well (see Exhibit 1).

capture

The S&P Global BMI Shariah and Dow Jones Islamic Market World Index each gained 6.4% YTD as of Sept. 30, 2016, outperforming their conventional counterparts by 120 bps and 140 bps, respectively.  Meanwhile in the U.S., the S&P 500® Shariah gained 6.2% over the same period, slightly outperforming the conventional S&P 500.  The Dow Jones Islamic Market Europe Index posted the largest outperformance relative to its conventional counterpart; its exclusion of the embattled European banking sector boosted its relative performance.

Emerging Markets Rebound, Supported by Low Rates

Supported by low and declining global interest rates, emerging market equities and currencies have bounced back in 2016, with the Dow Jones Islamic Market World Emerging Markets Index gaining 12.9% YTD as of Sept. 30, 2016, outpacing all other major regions.  European equities have lagged, as economic malaise continues to weigh on the region and the Brexit vote added to uncertainty.  U.S. and Asian markets each gained about 6% YTD as of Sept. 30, 2016, supporting the overall growth in global equities.

capture

MENA Equities Extend 2015 Losses

Despite a rebound in oil prices earlier in the year, MENA equities were sharply in the red as of Sept. 30, 2016, with the S&P Pan Arab Composite Shariah down nearly 9% YTD.  The conventional S&P Pan Arab Composite declined slightly less, aided by its relatively lower weight to Saudi Arabia, which has experienced double-digit losses.

The posts on this blog are opinions, not advice. Please read our Disclaimers.