Get Indexology® Blog updates via email.

In This List

VIX - The Enforcer

SPDJI Teleconference on U.S. Housing Set for February 25th @ 10am EST

Silver Anchors and Pains

Signs of Softness in Housing

Fixed Income Update: Presidents’ Day Week

VIX - The Enforcer

Contributor Image
Reid Steadman

Former Managing Director, Global Head of ESG & Innovation

S&P Dow Jones Indices

Your portfolio is like a hockey team.  You don’t think so?  It is.  And VIX plays a key role.  Stay with me while I explain.

Equities are your guys playing at center and on the wings.  You expect production from them.  Your team largely lives and dies by how consistently they score.  Bonds are your defensemen.  They come forward to create some additional offense at times, but their key responsibility is minimizing downside risk.  The goalie?  Perhaps not a perfect analogy, but let’s liken him to cash.  Your last line of defense.

Where does the CBOE Volatility Index (VIX) fit in all this?  Yes, if VIX were a hockey player, it would likely be on defense.  But VIX is a special type of defensive player.  In hockey parlance, VIX is an enforcer.

Someone took the time to write up a great description of what a hockey enforcer is.  “An enforcer’s job is to deter and respond to dirty or violent play. . .the enforcer is expected to respond aggressively. . .”  Further, “Enforcers are typically among the lowest scoring players on the team and receive a smaller share of ice time.”  In other words, most of the time you can’t expect much from an enforcer and you may not want to have him on the ice much.  But when it’s time for the enforcer to come to the rescue and protect the team, he does it in a big way — aggressively.

In your portfolio, VIX is your enforcer.  Maintaining a VIX position can be painful.  You would want to be selective as to when to allocate to VIX. But when things get really rough, you want to have VIX in the mix so it can aggressively defend your portfolio’s value, when every other asset class slinks away.

Below is a chart showing the performance of major indices during the last half of 2008, when the equivalent of a major hockey brawl broke out.  You remember it – broken teeth and blood on the ice everywhere.  VIX came to the rescue.  Those who allocated even a small portion of their portfolio to VIX linked instruments got some serious protection.

VIX graph

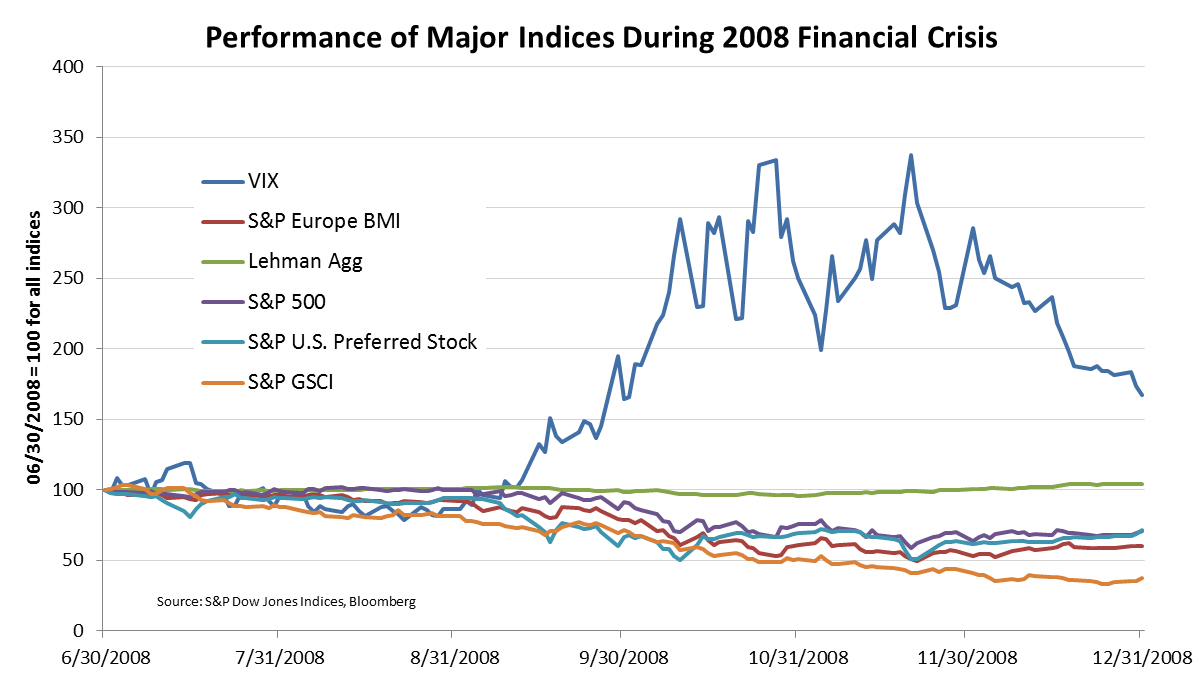
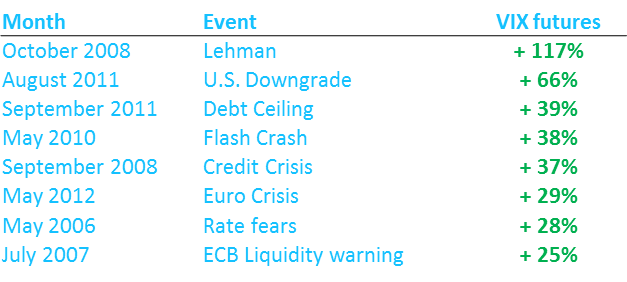
The 2008 crisis wasn’t the only time VIX stepped up.  Time after time, VIX and the instruments linked to them have responded quickly and in a pronounced way to violent market moves.

Picture1.jpg

We are still in turbulent times.  If you feel under threat, you may want to hire an enforcer.


The posts on this blog are opinions, not advice. Please read our Disclaimers.

SPDJI Teleconference on U.S. Housing Set for February 25th @ 10am EST

Contributor Image
Dave Guarino

Director, Global Index Communications

S&P Dow Jones Indices

Join us for a live teleconference on the US housing market on February 25th @ 10am EST. Featured speakers to include Professor Robert Shiller, Professor of Economics at Yale University and David Blitzer, Managing Director and Chairman of the Index Committee at S&P Dow Jones Indices. Instructions to access the teleconference are as follows:

Net Enhanced and Audio Streaming Info:

https://www.mymeetings.com/nc/join.php?i=PG4463870&p=INDICES&t=c

Or follow manual steps below:

URL: https://www.mymeetings.com/nc/join/
Conference number: PG4463870; Audience passcode: INDICES

Audio Streaming: (Audio Only)

http://event.on24.com/r.htm?e=754248&s=1&k=F4FA5732F644E1C30EAE3504F39A8375

The posts on this blog are opinions, not advice. Please read our Disclaimers.

Silver Anchors and Pains

Contributor Image
Jodie Gunzberg

Former Managing Director, Head of U.S. Equities

S&P Dow Jones Indices

Psychologists have studied feelings of Olympic medalists  for decades to find: “If you set aside the happy people who win gold and look only at the people who come in second and third, it’s the men and women with bronze medals who invariably look happier than the athletes who won silver.”

To investors who have studied behavioral finance, it is no surprise that the silver winners feel like gold losers. In economics, we call this framework loss aversion and it implies that one will feel more pain from a loss than happiness from a gain.

Whether a transaction is framed as a loss or as a gain is very important. For example, would you rather get a $5 discount, or avoid a $5 surcharge?  The same change in price framed differently has a significant effect on consumer behavior. Though traditional economists consider this “endowment effect” and all other effects of loss aversion to be completely irrational, that is why it is so important to the fields of marketing and behavioral finance.

The concept of loss aversion was first demonstrated by Amos Tversky and Daniel Kahneman. Later, in a publication by John Dawes, (Price changes and defection levels in a subscription-type market: can an estimation model really predict defection levels ?” Journal of Services Marketing Vol 18 No. 1 2004.), the effect of loss aversion in a marketing setting was demonstrated in a study of consumer reaction to price changes to insurance policies. The study found price increases had twice the effect on customer switching, compared to price decreases.

Silver’s performance, up 14.5% MTD and 13.0% YTD through Feb 18, 2014, may be causing the same feelings of anxiety, depending on how it’s framed. Suppose an investor picked silver as the commodity of choice in February, it seems like a winning choice.  However, it is only the second best performing commodity in the S&P GSCI, behind coffee, which gained a whopping 21.7% this month. The chance this investor is happy to have picked the second best commodity might not be so high since the mind frame may be a loss of 7.2%.

Another irrational behavior in finance is called anchoring. Anchoring which was also described by Tversky and Kahneman, occurs when people make estimates by starting from an initial value.  For example, in the Olympics, if two athletes competed in the 2010 games and one won a gold and the other won a bronze, then they both won silvers in 2014, the athlete who dropped from gold to silver might be more unhappy than the athlete who improved from bronze to silver.

Notice in the the chart below, there may be different feelings about holding or selling silver today based upon the price of purchase.  However, the irrational behavior is that it shouldn’t matter what the purchase price was considering the decision going forward to buy, hold or sell should be based on today’s price in relation to the future and not the past. An investor that bought silver in Oct 2008 may be feeling regret that s/he did not sell at the high in April 2011, and rather than being happy over a 125% gain is feeling upset over a 55% loss.  On the other hand, if an investor bought at the beginning of 2014 and has gained 13%, s/he may be feeling elated, and that of course is only if s/he is not sorry to have missed out on coffee.

Source: S&P Dow Jones Indices and/or its affiliates. Data from Jan 1973 to Feb 2014. Past performance is not an indication of future results. This chart reflects hypothetical historical performance. Please see the Performance Disclosure at the end of this document for more information regarding the inherent limitations associated with backtested performance.


The posts on this blog are opinions, not advice. Please read our Disclaimers.

Signs of Softness in Housing

Contributor Image
David Blitzer

Former Managing Director and Chairman of the Index Committee

S&P Dow Jones Indices

The National Association of Home Builders sentiment index for February, reported yesterday dropped sharply to 46 from 56 in January and an average of 51 for 2013.  A reading above 50 means more builders view the market as favorably than as unfavorable.  Housing permits and starts for January were reported this morning and are also disappointing.  Permits were down 5.4% from December overall and down 1.3% for single family homes. Total permits are up compared to January 2013 but single family units are flat.  Housing starts were weaker than permits with total starts down 16% from the previous month and off 2% from a year earlier. For single family units, the monthly drop was 15.9% and the year earlier decline was 6.7%.  The Mortgage Bankers Association index of mortgages for purchase is down 27% from its peak last May and down 16% from its recent peak on January 10th.

Housing is not about to collapse into another bust, but it is due for a pause after a strong rebound since the first half of 2012. A small portion of the softness may be due to extremely cold and snowy weather in the eastern half of the country. However, some of the weakness is more fundamental.  Having led the economy into recovery, albeit later than we would have liked, housing must now depend on gains in income and employment for its next upward leg.

housing

Further indications of housing can be seen in the past stock market performance of the S&P Home Builders Index (the red line) compared to the S&P 500 (the blue line).

More data will be forthcoming this week and next including existing and new home sales and the S&P/Case-Shiller Indices for December next Tuesday morning, February 25th.

The posts on this blog are opinions, not advice. Please read our Disclaimers.

Fixed Income Update: Presidents’ Day Week

Contributor Image
Kevin Horan

Former Director, Fixed Income Indices

S&P Dow Jones Indices

A short week ahead due to yesterday’s President’s Day Holiday.  Treasuries gained today as the Empire Manufacturing report released today was a 4.48.  The survey of manufacturing executives was bearish when compared to the expected number of 8.5 and its prior number of 12.51.  February’s home builder’s sentiment was also lower as the National Association of Home Builders Market Index reported a 46 compared to the surveyed number of 56.  The next three days will provide significant economic measures as the market continues to weight the degree of strength for the U.S. economy.  Tomorrow’s MBA Mortgage Applications (-2% prior), Housing Starts (950k expected) and Thursday’s CPI (0.3% expected), along with Initial Jobless Claims (335k expected), should provide some additional guidance.  In addition to economic releases, the Federal Reserve will release its January 28-29th meeting notes.

The S&P/BGCantor Current 10 Year U.S. Treasury Bond Index was down last week by -0.23% and is now down -0.43% for the month.  The Treasury issuance calendar is light for this week including Bill issuance and $9 billion of the 30-year TIPS on Thursday.

Year-to-date the S&P U.S. Issued Investment Grade Corporate Bond Index is still performing well with a 2.01% return.  Month-to-date the index has only returned 0.08%.  After a healthy January where investors moved investments up into investment grade from riskier assets, February has been flat so far.   Bond selling each week has detracted from the three solid days of price appreciation (Feb. 3rd, 7th and 13th) which totals 1.04%.

The S&P/LSTA U.S. Leveraged Loan 100 Index made up some ground last week as the index continued its bounce from the Feb. 5th month-to-date low of -0.11%.  The index is now slightly down for the month at -0.02% and is returning 0.6% year-to-date.  TXU continued to be a drag on the index but was also joined by Weight Watchers International whose price dropped on news that Barclays downgraded the issuer to underweight.

High Yield, as measured by the S&P U.S. Issued High Yield Corporate Bond Index, on the other hand was at the same -0.11% a day prior on Feb 4th but has been able to lift itself up to the current 0.76% MTD and is returning 1.53% year-to-date.  Oil & Gas Exploration along with Wireless are two of the larger industry segments in the index and month-to-date have contributed the most by 0.07% and 0.05% respectively.


Data as of 2/14/2014, Leverage Loan data as of 2/17/2014

The posts on this blog are opinions, not advice. Please read our Disclaimers.