Get Indexology® Blog updates via email.

In This List

Long-Term Underperformance of European Active Management continues to play out in the active versus passive debate.

Why Oil Index Investors Should Be Flying High

Active Management in Volatile Markets

Biggest Commodity Comeback Ever

Does Market Volatility Favor Active Management? Evidence From the 2015 Year-End 2015 SPIVA® U.S. Scorecard

Long-Term Underperformance of European Active Management continues to play out in the active versus passive debate.

Contributor Image
Daniel Ung

Former Director

Global Research & Design

Every six months, S&P Dow Jones Indices publishes the S&P Indices Versus Active (SPIVA®) Europe Scorecard, which seeks to compare the performance of actively managed equity funds across different categories, and in the SPIVA Europe Year-End 2015 Scorecard, we expanded it to cover more individual countries and regions.  Among the new additions are Italy, the Netherlands, Poland, Spain, Switzerland, and the Nordic region, with specific data for Denmark and Sweden.  This is also the first year-end report in which 10-year data is published for Europe. .  To access the full report, please click here and for the video summarizing the major findings of the report, please click here.

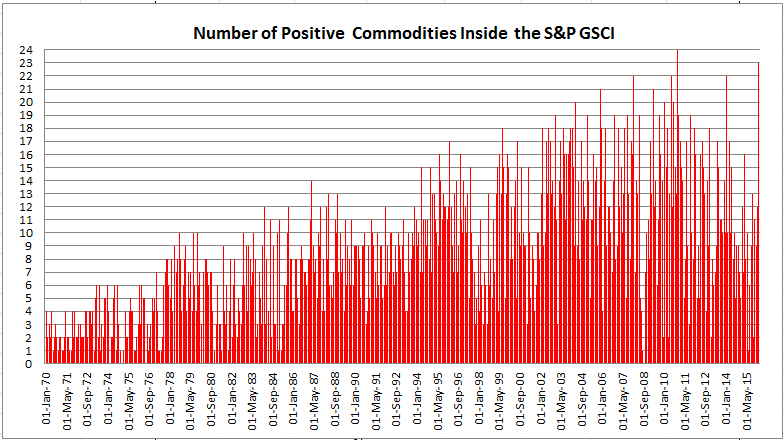
Global equity markets, as measured by the S&P Global 1200, rose 10.4% over the past one-year period, as measured in euros, which could largely be attributed to the European Central Bank’s quantitative easing program.  However, this apparently positive performance masked the heightened volatility that the equity markets experienced over the course of the year, which was a consequence of anemic Chinese growth, as well as the collapse in energy and commodity prices.

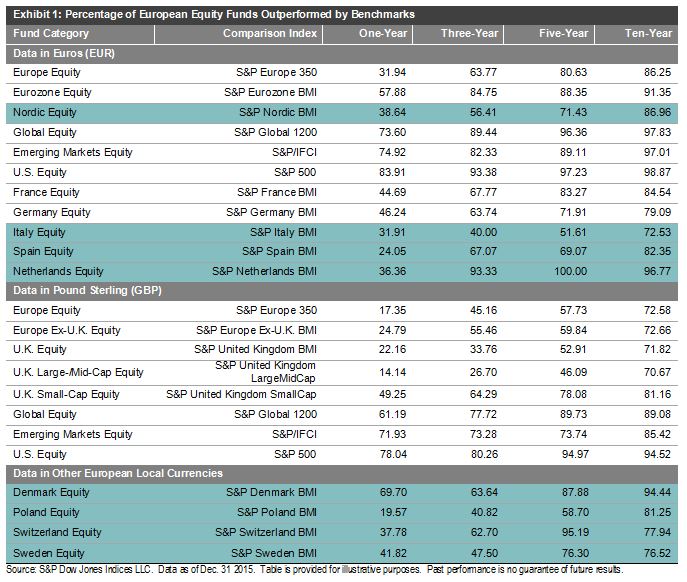
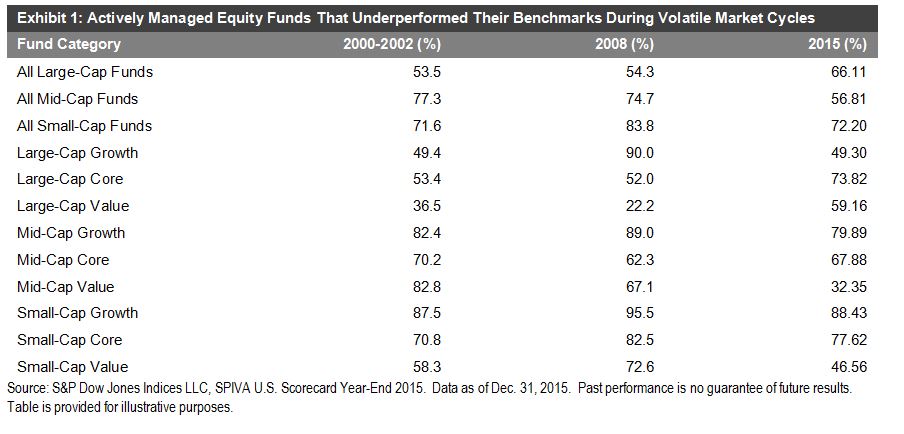
Compared to the S&P Europe 350, while 68.1% of active managers outperformed the benchmark over the short run, they underperformed the benchmark over longer time horizons.  63.8% of active managers underperformed the benchmark by the end of the three-year period, 80.6% in the five-year period, and 86.3% over the 10-year period.   Exhibit 1 shows the new categories highlighted in blue.

As for the global, emerging market, and U.S. equity categories, actively managed funds—in both euro and pound sterling—underperformed substantially in the short term (one-year category) and in the long run (10-year category).  For instance, 61.2% of global equity funds underperformed their benchmark over a one-year period, and 89.08% of funds underperformed the benchmark over a 10-year period.

Capture

The posts on this blog are opinions, not advice. Please read our Disclaimers.

Why Oil Index Investors Should Be Flying High

Contributor Image
Jodie Gunzberg

Former Managing Director, Head of U.S. Equities

S&P Dow Jones Indices

Today in the Wall Street Journal, there is an article, “Airlines Retreat on Fuel Hedging“, that highlights the losses airline companies suffered by hedging against oil and gas rises. However, the article also points out that not all airlines hedged, including American Airlines Group (NASDAQ: AAL), who enjoyed the benefit of cheaper fuel. Scott Kirby, president of AAL, was quoted, “hedging is just a rigged game that enriches Wall Street.”

Kudos to him and his shareholders for betting in the right direction. Not every commercial consumer (airline) made that choice, but the important point is that hedging against an oil price rise is a choice about managing risk. Hedging price risk to keep a company in business is not a Wall Street game, but it is possible Kirby was referring to Paul Cootner’s research from MIT in the 1960’s that explains commercial hedging as a highly specialized form of speculation.

In a letter to the FT, Hilary Till points out the futures markets exists to help companies specialize in risk taking by allowing them to use the basis risk, the difference between the spot and futures prices, to manage risk. This is helpful since the basis risk is more predictable than the commodity prices themselves. In the same article, Till points out Holbrook Working’s research from Stanford in the 1950’s showing that it is not necessarily precise daily correlation that matters for choosing a proxy hedge, but whether the proxy hedge provides a business with protection during a dramatic price move that could bankrupt a company.

However, not all companies are similarly vulnerable to bankruptcy from commodity price moves. The producers need protection against price drops more than commercial consumers need protection against price increases. So, the producers go short to protect against price drops and the consumers go long to protect against price increases, and the result is naturally more commercial shorts than longs.

Hedging Pressure

This also true specifically in oil where there has been consistently more commercial short hedging than commercial long hedging.

Source: CFTC http://www.cftc.gov/oce/web/crude_oil.htm

The reason this is the case is supported by two economic theories: 1. Hicks’ theory of congenital weakness that argues it is easier for consumers to choose alternatives so they are less vulnerable to price increases than producers are to price drops, and 2. Keynes’ theory of “normal backwardation” that argues producers sell commodities in advance at a discount which causes downward price pressure, which converges to the spot at the time of delivery.

In the futures market, this gap needs to be filled between producers and commercial consumers that are hedging, opening the door for long commodity investors to earn a return called the insurance risk premium. This is illustrated by the bigger share of non-commercial longs than shorts.

Source: CFTC http://www.cftc.gov/oce/web/crude_oil.htm

This relationship is time tested and has remained stable as examined by Bhardwaj, Gorton and Rouwenhorst. They conclude although open interest has more than doubled for the average commodity since 2004, the composition of the open interest has remained remarkably stable.

Source: Yale ICF Working Paper No. 15-18. Facts and Fantasies about Commodity Futures Ten Years Later. Geetesh Bhardwaj SummerHaven Investment Management Gary Gorton Yale University NBER Geert Rouwenhorst Yale University
Source: Yale ICF Working Paper No. 15-18. Facts and Fantasies about Commodity Futures Ten Years Later. Geetesh Bhardwaj, SummerHaven Investment Management, Gary Gorton, Yale University, NBER, Geert Rouwenhorst, Yale University. May 25, 2015.

Oil index investors that use long futures should be excited if all of the above holds true and airlines really are retreating on their hedging. The implication is that there may be a bigger risk premium to be earned as the net shorts grow (from the absence of airline long hedging.) The oil producers still hold more risk than commercial consumers and will likely pay investors to offset that risk. The timing may be perfect too with the signals that show oil may have bottomed. You can read about these two signals here and here.


The posts on this blog are opinions, not advice. Please read our Disclaimers.

Active Management in Volatile Markets

Contributor Image
Craig Lazzara

Former Managing Director, Index Investment Strategy

S&P Dow Jones Indices

More than a year ago, a number of commentators expressed confidence that 2015 would be the year when active equity management proved its value.  After all, the market had risen steadily for six years, and with stretched valuations, market volatility was likely to rise — creating opportunities for active managers to add value by skillful risk control.

This seems like a plausible theory — if only the facts had not conspired to rebut it.  Our SPIVA report for calendar 2015 shows that the majority of actively-managed U.S. mutual funds underperformed cap-weighted index benchmarks.  Similarly, the majority of large-cap institutional portfolios tracked in the eVestment database underperformed the S&P 500 Index.

Why was 2015 so difficult for active U.S. equity managers?  Answering this question requires us to distinguish between two oft-conflated concepts: the manager’s skill at stock selection or sector rotation, and the level of opportunity to demonstrate that skill.  Beyond observing that, in a market dominated by institutional players, the average manager cannot expect to outperform the market average, we have no particular insight into manager skill.  But opportunity can be measured systematically by the market’s dispersion, and dispersion in 2015, though slightly above 2014’s level, remained quite low by historical standards.

The level of a manager’s skill is independent of dispersion, but the value of his skill is dispersion-contingent.  The graph below illustrates this by reference to the interquartile range for large-cap U.S. managers in our SPIVA database.

Source: S&P Dow Jones Indices’ SPIVA (“S&P Indices Versus Active”) scorecards . Data for 2007 are for December 31, 2006 through March 31, 2007; all other years are full calendar years. Charts are provided for illustrative purposes. Past performance is no guarantee of future results.

The bars represent the difference between top quartile and bottom quartile managers or, crudely speaking, the performance gap between “good” and “bad” managers in each year.  The line is the average level of dispersion during the year.  It’s hardly a perfect fit, but nonetheless it seems clear that managers have more scope to demonstrate their skill when dispersion is high.

In most markets, dispersion in early 2016 was higher than its average 2015 level.  If this trend continues, 2016 could at last see the long-awaited stock pickers’ market, and a widening of the gap between top and bottom performers.  If dispersion reverts to its 2015 levels, however, even good active managers will continue to face a challenging environment.

The posts on this blog are opinions, not advice. Please read our Disclaimers.

Biggest Commodity Comeback Ever

Contributor Image
Jodie Gunzberg

Former Managing Director, Head of U.S. Equities

S&P Dow Jones Indices

St. Patrick’s Day didn’t just have a pot of gold at the end of the rainbow, but had basically the whole commodity basket. The S&P GSCI that represents the world’s most significant commodities, ended Mar. 17 with a positive total return year-to-date for the first time in 2016, up 1.9%.

Source: S&P Dow Jones Indices.

The index reached its highest level since Dec. 10, 2015, and gained 18.8% since its bottom on Jan. 20, 2016. This is the most the index has ever increased in just 40 days after bottoms.

Source: S&P Dow Jones Indices

Further, now in March, 23 of 24 commodities are positive. This is the most ever in a month with one exception when all 24 commodities were positive in Dec 2010. It is also the fastest so many monthly returns of commodities changed from negative to positive, making a comeback from Nov. 2015 when just two commodities were positive.

Source: S&P Dow Jones Indices.

Now, only aluminum is negative in Mar., down 3.1%. However, its roll yield recently turned positive that shows more scarcity (that is very rare for aluminum,) indicating it may turn with the rest of the metals. Especially if the U.S. dollar weakens, the industrial metals tend to benefit most of all commodities. That says a lot about their economic sensitivity given all commodities rise with a weak dollar.


The posts on this blog are opinions, not advice. Please read our Disclaimers.

Does Market Volatility Favor Active Management? Evidence From the 2015 Year-End 2015 SPIVA® U.S. Scorecard

Contributor Image
Aye Soe

Former Managing Director, Global Head of Core and Multi-Asset Product Management

S&P Dow Jones Indices

Twice a year, S&P Dow Jones Indices releases the SPIVA U.S. Scorecard.  The scorecard measures the performance of actively managed equity and fixed income funds across various categories.  Since the initiation of the report in 2002, the results have consistently shown that managers across most categories overwhelmingly underperform on a relative basis against their corresponding benchmarks over a medium- to long-term investment horizon.

The Year-End 2015 SPIVA U.S. Scorecard reveals little surprise.  The second half of 2015 was marked by significant market volatility, which was brought forth by plunging commodity prices, a strengthening U.S. dollar, growing global concerns over Chinese economic growth, and the subsequent devaluation of the Chinese renminbi.

Market volatility, in theory, favors active investing, because managers can tactically move out of their positions at their discretion and park themselves in cash.  Passive investing, on the other hand, has to remain fully invested in the market.  Investors in actively managed strategies should therefore realize fewer losses during periods of heightened volatility, all else being equal.

Given this theoretical background, recent volatility in the market has supporters of active investing proclaiming that active management is back in favor.

However, over a decade of experience in publishing the SPIVA Scorecard has painfully taught us that active funds don’t always perform better than their passive counterparts during those precise periods in which active management skills seem to be called for.  Exhibit 1 compares the performance of actively managed equity funds across the nine style boxes during the 2000-2002 bear market, the financial crisis of 2008, and 2015.

As the data clearly show, there is no consistent pattern across most of the categories.  Large-cap value managers appear to be the only exception to the losing trend, outperforming their benchmark in both bear markets.  Again in 2015, mid-cap value is the only winning equity category, with the majority (67.65%) of them outperforming the S&P MidCap 400® Value.

Capture

The posts on this blog are opinions, not advice. Please read our Disclaimers.