Get Indexology® Blog updates via email.

In This List

Making the Patient Sicker

Paper by Professor Bondarenko Has Intriguing New Analysis of PUT and WPUT Indexes

Factor Based Indices in India

Oil Gains This Big Only Happen Around Bottoms

Pure Style Eliminates the Muddle in the Middle

Making the Patient Sicker

Contributor Image
Craig Lazzara

Former Managing Director, Index Investment Strategy

S&P Dow Jones Indices

Years ago, I saw a cartoon picturing two Victorian-era doctors discussing a patient.  “What did you prescribe for Jones’ rheumatism?” asked the first; the second answered “A cold bath and a brisk walk every morning.”  “Good God, man, that will give him pneumonia!” said the first.  “I know,” replied the second doctor, “I made my reputation curing that.”

Somehow I was reminded of this exchange when I learned from this morning’s news that some institutional investors, smarting from recent losses, are considering increasing their commitment to active equity management.  Their operating assumption seems to be that active managers will do a better job of capital preservation in a challenging and volatile market.

There’s certainly some plausibility to this argument.  It turns out, however, to be another beautiful theory mugged by a gang of facts.  The facts come from our periodic SPIVA reports, which compare the results of actively-managed mutual funds against passive benchmarks.  Weak markets, it turns out, are no panacea for active managers.  In 2008, e.g., 54% of large-cap U.S. funds underperformed the S&P 500.  Results were even worse for mid- and small-cap managers (75% and 84% underperformers, respectively).

Statistics say, in other words, that moving from passive to active as a way of managing market volatility is likely to make performance worse, not better.  Fortunately for anxious investors, passive strategies which focus on the lowest volatility segment of the equity market are most likely to outperform precisely when the market is weakest.  Consider, for example, the S&P 500 Low Volatility Index and its cousin, the S&P 500 Low Volatility High Dividend Index:

LV and baby LV to 021816

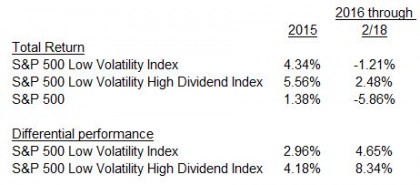
Both of these indices are designed to attenuate the returns of the S&P 500 in both directions; historically they have both tended to underperform market rallies but outperform when markets are weak.  Their reliability as defensive vehicles has far exceeded that of active management.  Investors concerned about continuing volatility and market weakness should consider indicizing their defensive strategies.


The posts on this blog are opinions, not advice. Please read our Disclaimers.

Paper by Professor Bondarenko Has Intriguing New Analysis of PUT and WPUT Indexes

Contributor Image
Matt Moran

Head of Index Insights

Cboe Global Markets

Jan. 27, 2016 – A new 10-page study examines both the CBOE S&P 500 PutWrite Index (PUT) and the CBOE S&P 500 One-Week PutWrite Index (WPUT), comparing their performances with that of traditional benchmark stock and bond indexes. This is the first comprehensive published study that examines the performance of a benchmark strategy index that incorporates Weeklys options. Written by Oleg Bondarenko, professor of finance at the University of Illinois at Chicago, the study — “An Analysis of Index Option Writing with Monthly and Weekly Rollover”– analyzes the performance of the two indexes through the end of 2015.

The new paper discusses 19 Exhibits. In this Blog I highlight 5 of the Exhibits.

1. HIGHER AGGREGATE GROSS PREMIUMS USING S&P 500® WEEKLYS OPTIONS

CBOE introduced Weeklys options in 2005. In the initial years of Weeklys trading, it appeared to me that some observers thought that Weeklys might be used primarily by retail speculators, but in recent years I have heard from multiple institutional investors that they are writing S&P 500 Weeklys options for the purposes of prudent income enhancement. The new study found that, from 2006 to 2015, the average annual gross premium collected was 24.1 percent for the PUT Index and 39.3 percent for the WPUT Index. While a one-time premium collected by the weekly WPUT Index usually was smaller than a premium collected by the monthly PUT Index, the WPUT Index had higher aggregate annual premiums because: (1) premiums were collected 52 times, rather than 12 times, per year, and (2) time decay (or theta) usually works in favor of the WPUT Index vs. the PUT Index.

1 - Premiums PUT WPUT
2. PUT INDEX HAD HIGHEST RETURNS SINCE MID-1986

In the period from mid-1986 through the end of 2015 –

  • (1) The total % growth for benchmark indexes was 1622% for the PUT Index, 1499% for the S&P 500 Index, and 646% for the Citigroup 30-year Treasury Bond Index; (all of the indexes (except the VIX® Index) in this Blog are total return indexes), and
  • (2) The annual compound return of the PUT Index was 10.13 percent, compared with 9.85 percent for the S&P 500 Index.

2 - long-tern line PUT

3. DRAWDOWNS WERE LESS SEVERE FOR PUT AND WPUT INDEXES (COMPARED TO S&P 500)

From 2006 through 2015, the worst drawdowns were down 24.2 percent for WPUT, down 32.7 percent for PUT and down 50.9 percent for the S&P 500.

3 - Drawdown PUT WPUT
4. HIGHER RISK-ADJUSTED RETURNS FOR PUT INDEX

Over a period of 29½ years, the PUT Index had higher risk-adjusted returns (as measured by the Sharpe Ratio, Sortino Ratio, and Stutzer Index) than the S&P 500, Russell 2000, MSCI World, and Citigroup 30-Year Treasury Bond Indexes. However, please note that many risk-adjusted return metrics assume a normal distribution with no skewness, but there was negative skewness for several indexes, including PUT (-2.09), S&P 500 (-0.79), and Russell 2000 (-0.89).

4 - Sharpe Sortino

5. SOURCE OF RETURNS – RICHLY PRICED SPX OPTIONS

An inquiring investor might ask – how could the PUT Index have higher returns and lower volatility over a period of almost three decades? A key source of returns for sellers of SPX index options has been the fact that, according to Exhibit 5, these options have been richly priced in all the years since 1990 (except in 2008).

5 - Rich Pricing

MORE INFORMATION

For links to the new paper and to several other options-based strategy papers, and to data and information on the PUT and WPUT indexes, please visit www.cboe.com/benchmarks.

The posts on this blog are opinions, not advice. Please read our Disclaimers.

Factor Based Indices in India

Contributor Image
Utkarsh Agrawal

Associate Director, Global Research & Design

S&P Dow Jones Indices

The recent turmoil in the Chinese market has taken the global market on a turbulent ride since the beginning of 2016. India was no exception. During the first two weeks of 2016, the S&P BSE SENSEX lost almost 6.37%, making some investors jittery. Foreign investors took out almost INR 34.84 billion from the Indian stock market, while mutual funds added close to INR 28.18 over the same time period. While the broader stock market suffered a huge draw down through January 15, 2016, let’s see how a new series of factor based indices that were recently launched by Asia Index Private Limited fared over the same time frame based on back-tested data.

A high-level summary of the characteristics of these indices is as follows.

  • All four of the factor based indices include 30 stocks from the S&P BSE LargeMidCap. The constituents differ depending on the rules of the index.
  • The S&P BSE LargeMidCap is a size sub-index of S&P BSE AllCap. Its methodology is designed to cover approximately 85% of the total market cap of the S&P BSE AllCap and is a float-market-weighted index.
  • The S&P BSE Enhanced Value Index consists of “best value” stocks according to a proprietary methodology. “Value” is measured using the price-to-book, price-to-earnings, and price-to-sales ratios of companies.
  • The S&P BSE Low Volatility Index consists of the least-volatile stocks measured over a one-year period.
  • The S&P BSE Momentum Index consists of the stocks within the S&P BSE LargeMidCap with the highest momentum measured over a one-year period. Momentum is measured as risk-adjusted price performance over time.
  • The S&P BSE Quality Index consists of the “highest quality” stocks according to a proprietary methodology. Quality is measured using the return-on-equity, financial leverage, and accrual ratios of companies.

Over the past two years ending Jan. 15, 2016, the S&P BSE Quality Index had a cumulative total return of 55.46%, which was the highest among the four factor indices (see Exhibit 1). It was followed by the S&P BSE Low Volatility Index, which had a cumulative total return of 52.58%. Over the same period, the S&P BSE Enhanced Value Index performed lower than the S&P BSE LargeMidCap. While the S&P BSE Quality Index and the S&P BSE Low Volatility Index displayed lower volatility in comparison with the S&P BSE LargeMidCap (see Exhibit 2), the S&P BSE Enhanced Value Index was 80% more volatile than the S&P BSE LargeMidCap over the same two-year period.

Over the past one-year period ending Jan. 15, 2016, the S&P BSE Low Volatility Index, the S&P BSE Momentum Index, and the S&P BSE Quality Index were in the black, even though the S&P BSE LargeMidCap ended in the red (see Exhibit 1). The S&P BSE Low Volatility Index and the S&P BSE Quality Index even displayed lower volatility than the S&P BSE LargeMidCap (see Exhibit 2). Over the same period, the S&P BSE Enhanced Value Index lost 24%, which was more than two-times the decline suffered by the S&P BSE LargeMidCap (see Exhibit 1).

During the six-month period ending Jan. 15, 2016, all of the indices delivered negative performance (see Exhibit 1). The S&P BSE Enhanced Value Index remained the most volatile and suffered the largest decline of the four of the factor based indices (see Exhibit 2).

Overall, the markets have been in the bear mode, and we can notice that factor based indices displayed their own risk/return characteristics.

Ex - Cumlative Returns


Ex - Annualized Volatility


The posts on this blog are opinions, not advice. Please read our Disclaimers.

Oil Gains This Big Only Happen Around Bottoms

Contributor Image
Jodie Gunzberg

Former Managing Director, Head of U.S. Equities

S&P Dow Jones Indices

The S&P GSCI (WTI) Crude Oil posted a 3-day gain of 14.4% ending Feb. 17, 2016. This is the biggest 3-day gain in about 6 months for the index, and gains of this magnitude have only happened near oil bottoms.

Source: S&P Dow Jones Indices.

After the index hit its lowest since Nov 4, 2003, on Jan. 20, 2016, it capitulated, reaching near that level again, a few days ago on Feb. 11. Then oil spiked on news of the possibility of a production freeze from OPEC and non-OPEC producers, but quickly waned after hopes diminished and the reality of the lack of potential impact hit.  OPEC has the ability to be the swing producer given its large market share, spare capacity, low production costs and capability of acting alone or in a cartel; however, U.S. inventories need to be low for it to matter.

Source: Bloomberg, IEA.
Source: Till, Hilary. Does OPEC Spare Capacity Matter? Modern Trader Magazine. May 16, 2016. Data Sources are Bloomberg and IEA.

The production coordination of U.S. shale producers is difficult since there are too many players that are always aiming to produce as much oil profitably as possible. Today, the American Petroleum Institute  reported an unexpected decline in U.S. inventories that excited the market.

Source: http://www.investing.com/economic-calendar/api-weekly-crude-stock-656
Source: http://www.investing.com/economic-calendar/api-weekly-crude-stock-656. Feb 17, 2016

Without the decline in inventories from the U.S., the potential impact of an OPEC production freeze is far less. This makes the U.S. inventory arguably more important than the production decisions of the swing producer, Saudi Arabia, but as the U.S. inventory drops, the picture may shift the oil price power back towards Saudi Arabia.


The posts on this blog are opinions, not advice. Please read our Disclaimers.

Pure Style Eliminates the Muddle in the Middle

Contributor Image
Shaun Wurzbach

Managing Director, Head of Commercial Group (North America)

S&P Dow Jones Indices

Financial advisors who implement style investing seek to outperform the blended benchmark whenever they believe that market conditions will favor either a growth or a value approach.  Their view could be influenced by research, fundamental factors, or technicals.  To implement such a view does not require 100% conviction in either growth or value.  In fact, some prefer to “tilt” toward growth or value by maintaining a reduced position in the less-favored style.  As a hypothetical example, advisors have shown me portfolios with a 60% weighting in value and 40% in growth.  Such an example overweights value stocks compared to the blended benchmark.

If we accept that some style investors “tilt” as their implementation technique, then we recognize that these advisors are creating a mixed basket of stocks that have a combination of growth and value characteristics.  In accepting this mix, many advisors overlook that the overlap in styles is more profound than they may expect based on a “technical” term that I call “the muddle in the middle.”

This “muddle in the middle” is a side effect of the way most index providers create style baskets.  Using the S&P 500® as an example, Exhibit 1 shows how the S&P 500 Growth and S&P 500 Value are constructed.

Capture

While this index construction technique has existed for many years and is widely practiced, it is less understood that the stocks in the middle, or blend basket, are assigned to both the growth and value indices.  This “muddle in the middle” currently leads to 172 overlapping stocks in the S&P 500 Style Indices that don’t have strong growth or value characteristics (see Exhibit 2).

Capture

The S&P Pure Style Indices were created to measure concentrated style expressions while eliminating the blend basket.  The S&P Pure Style Indices measure, select, and retain only the strongest growth and value stocks and weight the constituents in accordance with their style score.  The two approaches to basket selection can be compared in Exhibit 3 with the S&P Style Indices on the left and the S&P Pure Style Indices on the right.

Capture

The S&P Pure Style Indices seek to create style baskets without any stock overlap.  The S&P Pure Style Indices eliminate the “muddle in the middle” problem for style investing (see Exhibit 4).

Capture

The ramification for advisors employing a style tilt is that the same 60% value and 40% growth tilt imagined before now results in zero stocks overlapping in the resulting portfolio, instead of 172.  S&P Dow Jones Indices has over 10 years of live index history for the S&P Pure Style Indices (launched on Dec. 16, 2005) that can be shared with advisors in the S&P 500, S&P MidCap 400®, and S&P SmallCap 600® size classifications.

Sam Stovall, Equity Strategist at S&P Global Market Intelligence, plans to cover S&P Pure Style Indices as Smart Beta in one of his “7 Rules of Wall Street Strategies” at our FA Forum in Miami on Feb. 24, 2016.  Advisors may register at no cost to attend in person or by live streaming.

The posts on this blog are opinions, not advice. Please read our Disclaimers.