Get Indexology® Blog updates via email.

In This List

The Rieger Report: "Belly" of the Curve Rewards Municipal Bond Market

New Risk-Off: More Fear Today Than Tomorrow

The Highs and Lows of the High Yield Energy and Materials Sectors

The Rieger Report: Liquidity and Bond Index Design

All that Debt

The Rieger Report: "Belly" of the Curve Rewards Municipal Bond Market

Contributor Image
J.R. Rieger

Former Head of Fixed Income Indices

S&P Dow Jones Indices

The ‘belly’ of the municipal bond curve or the 5 – 10 year maturity range has done well this year, almost as well as the longer maturity range.   Returns for non-callable investment grade municipal bonds tracked in the 5, 7 and 9 year range all have demonstrated good returns in this low rate environment.

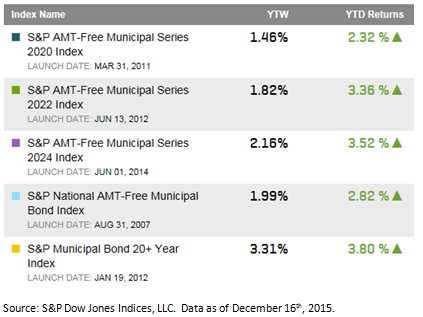
The S&P AMT-Free Municipal Series 2024 Index shows non-callable municipal bonds maturing in 2024 have an average yield of 2.16% and have returned 3.5% year-to-date.   This range has outperformed the composite S&P National AMT-Free Municipal Bond Index and has nearly kept pace with longer bonds tracked in the S&P Municipal Bond 20+ Year Index.

Table 1: Select Municipal Bond Indices Yields and Returns:Muni Belly 12 16 2015

The posts on this blog are opinions, not advice. Please read our Disclaimers.

New Risk-Off: More Fear Today Than Tomorrow

Contributor Image
Jodie Gunzberg

Former Managing Director, Head of U.S. Equities

S&P Dow Jones Indices

It has been over nine years since the Fed raised interest rates, but today, the Fed raised rates just as expected. While the Fed actions have been well telegraphed, and interest rates are probably the least of worries for commodities, there is one measure that might be worrisome.

Although since 1991, rising rates seem not to have been a decisive factor in equity performance, and have clearly not been a negative force (as shown in the chart below from this paper,) there is more uncertainty about the stock market today than tomorrow. 

Rising rates Stocks

One indicator of extreme market stress can be seen when the price of futures contract on the CBOE Volatility Index® (VIX) with a nearby expiration is more expensive than one later dated. This condition is called backwardation (it sounds like a bad diagnosis and usually is) but it is relatively rare, happening in only 17% of days since Mar. 29, 2004.

The futures contracts are now reflecting this condition for five days straight. This has happened a number of times before but one of the interesting things about today is that the market seems not only uncertain but downright jittery. It looks a bit like in 2007, soon after the Fed starting raising rates, when the market felt noticeable fear by the measured backwardation. It’s not the fear alone but the persistence. Just a few months ago, from Aug. 20 – Oct. 7, the Chinese stock market crash sent chills through the market. Backwardation appeared again from Nov. 13 – 16 with one of the biggest weekly stock market drops in months that crashed the S&P 500’s 200-day moving average, a bearish signal for many investors. Again, ahead of the Fed decision – which should not have been surprising – backwardation appeared and is present. The chart below shows the history of VIX backwardation with the S&P 500 index levels. The green triangles represent when the Fed raised rates in 2006 and when they started quantitative easing in 2008.

Source: S&P Dow Jones Indices

While the interest rates alone have not influenced stock prices, the unprecedented quantitative easing started a vicious cycle of risk-on/risk-off (RORO) that was the result of a binary outcome for risky assets – either the easing works OR it doesn’t. Since commodities are a risky asset, they are a class where the returns are noticeably impacted by fear before the financial crisis and after, when quantitative easing began. Pre-crisis, there was no relationship between a high VIX and commodities, but the relationship turned negative post-crisis.

Source: S&P Dow Jones Indices. Data from Jan 1990 to July 2013. Past performance is not an indication of future results. This chart reflects hypothetical historical performance. Please see the Performance Disclosure at the end of this document for more information regarding the inherent limitations associated with backtested performance
Source: S&P Dow Jones Indices. Data from Jan 1990 to July 2013. Past performance is not an indication of future results. This chart reflects hypothetical historical performance. Please see the Performance Disclosure at the end of this document for more information regarding the inherent limitations associated with backtested performance.

The RORO environment meant investors either felt they were, or were not getting paid for taking the risk to invest in risky assets. This drove up the correlation of commodities with stocks to unprecedented levels, just over 0.7. By 2013, the Fed started to taper and the correlation fell back to zero, and stayed below its average of 0.26 until Aug., 2015, precisely when VIX backwardation appeared. In just slightly more than one month, the correlation doubled from 0.22 (Aug. 20, 2015) to 0.44 (Sep. 28, 2015). Since then, it has increased slightly more to 0.46, its highest level in over two years, since Aug. 20, 2013.

The one thing to worry about is the combination of higher than average VIX backwardation with high risky-asset (stock/commodity) correlation. This only happened three times before now. Once in the financial crisis, once in 2011 just following the debt ceiling crisis and U.S. downgrade, and for a very short time in the 2010 flash crash. This is illustrated in the chart below where the S&P 500 represents stocks and the S&P GSCI represents commodities.

Source: S&P Dow Jones Indices


The posts on this blog are opinions, not advice. Please read our Disclaimers.

The Highs and Lows of the High Yield Energy and Materials Sectors

Contributor Image
Kevin Horan

Former Director, Fixed Income Indices

S&P Dow Jones Indices

The S&P U.S. Issued High Yield Corporate Bond Index has just over USD1 trillion of par amount outstanding while its total return is down 3.11% for the month and down 4.51% YTD.  The energy and materials sectors have been the sore spot for the high yield market, given the anxiety over credit quality, as current low prices in oil and commodities, along with a Fed increase in rates, may be a cause for concern for future earnings and the cost of capital.  The return of the S&P U.S. Issued High Yield Corporate Bond Index ex energy and materials sectors would be less affected, returning -2.14% for the month and -0.05% YTD.

The growth of the high yield market since the 2008 financial crisis has been significant; the par amount outstanding of the S&P U.S. Issued High Yield Corporate Bond Index increased by 65% from Dec. 31, 2008, to Dec. 15,, 2015.  As shown in Exhibit 1, the growth in issuance within the energy and materials sectors has been significant as well. At its highest in September 2014, the energy sector reached USD 207 billion and has since dropped to USD 122 billion.  Materials was as low as USD 33 billion in March 2009 before peaking at USD 102 billion in December 2014, and it was at USD 81 billion par outstanding as of Dec. 16, 2015.

Exhibit 1: Energy & Materials Sector Growth
Percent Change in Par Amount Outstanding

Source: S&P Dow Jones Indices LLC., Data as of Dec. 15, 2015. Past performance is no guarantee of future results.  Chart is provided for illustrative purposes and contains hypothetical historical performance.

The posts on this blog are opinions, not advice. Please read our Disclaimers.

The Rieger Report: Liquidity and Bond Index Design

Contributor Image
J.R. Rieger

Former Head of Fixed Income Indices

S&P Dow Jones Indices

As the liquidity of recent markets have been tested by the impact of low energy prices a look at index design and results may be valuable.  Focusing on investment grade corporate  bonds we can see dramatic differences in depth of liquidity as a result of index design.

For investment grade corporate bonds two indices tracking these markets have very different liquidity profiles. Let’s compare the liquidity data of the bonds in the S&P 500 Investment Grade Corporate Bond Index to the broader S&P U.S. Issued Investment Grade Bond Index.  The S&P 500 Investment Grade Corporate Bond Index  provides a view of the performance of corporate bonds issued by the blue chip companies in the iconic S&P 500 Index,  other index inclusion criteria including par amount minimums are the same as the broader corporate bond index.

Results:

  • More of the bonds in the index are trading each month: During the six month period of June through November 2015 bonds in the S&P 500 Investment Grade Corporate Bond Index had a higher percentage of trading each month: approximately 95% of the bonds in this index traded each month vs. 89% of the bonds in the S&P U.S. Issued Investment Grade Bond Index. Please refer to Table 1 below for the data.
  • Fewer bonds but significant representation of the bonds trading: The S&P 500 Investment Grade Corporate Bond Index has fewer bonds than the broader index but the average trade volume of bonds in the index as measured by the number of trades, market value of trades and total market value of trades represent a high percentage of the trading volume of the broader index. Please refer to Table 2 below for the data.

Table 1: Trade Volume: Average Par Value Traded, % of Constituents TradedTable 2 Trade Volume

Table 2: Trade Volume:  Market & Par Value TradedTable 1 Trade Volume

The data illustrates that tracking the larger entities such as the blue chip companies in the S&P 500 Index results in significantly better liquidity characteristics for the underlying bonds than broader benchmarks.


The posts on this blog are opinions, not advice. Please read our Disclaimers.

All that Debt

Contributor Image
David Blitzer

Former Managing Director and Chairman of the Index Committee

S&P Dow Jones Indices

As the Fed prepares to raise interest rates on Wednesday – or surprise virtually everyone – it is worth looking at the debt in the economy.  Interest expenses for most of it won’t move very much or very soon, but some believe the Fed is embarking on a two to three year process of pushing interest rates every upward.

The chart tells the story.  The pale green line with the peak at about 2008 is the domestic financial sector – banks, brokerages, insurance companies and so forth. Like most sectors, this one peaked as the financial crisis hit; unlike some sectors it has paid down a lot of debt and then resumed its climb. Since the mid 1990s the growth of financial sector debt outpaced everything else, it may be poised to outpace most other sectors going forward.  The red line – home mortgages — has the second largest dip after financials and it too is recovering.  Neither of these suggests a major change or retrenchment following the financial crisis.  Another sector that gets a lot of attention is the pink line trying to flatten out in the latest couple of quarters – federal government borrowings.  Corporate business, the gold colored line, staged a sharp rise in the last few years.

The bottom four sectors are a bit more stable and represent foreign borrowing in the U.S., state and local government debts, consumer credit and non-corporate borrowing.

The message here is two parts: one reason the last recession was called the Great Recession is the large and rapidly growing debt throughout the economy in 2007-2008; second is the hope that a small rise in interest rates and borrowing costs will moderate the current growth rates well before the next recession.

The posts on this blog are opinions, not advice. Please read our Disclaimers.