Get Indexology® Blog updates via email.

In This List

Perseverance and Low Vol

Contango Costs Oil Investors 10 Extra Years

Tracking Activist Hedge Fund Activities

Probability of Fed Rate Hike in September Rises

Asia Fixed Income: Weakening Ringgit Triggered Bond Outflow

Perseverance and Low Vol

Contributor Image
Fei Mei Chan

Former Director, Core Product Management

S&P Dow Jones Indices

“He conquers who endures.” ~Persius

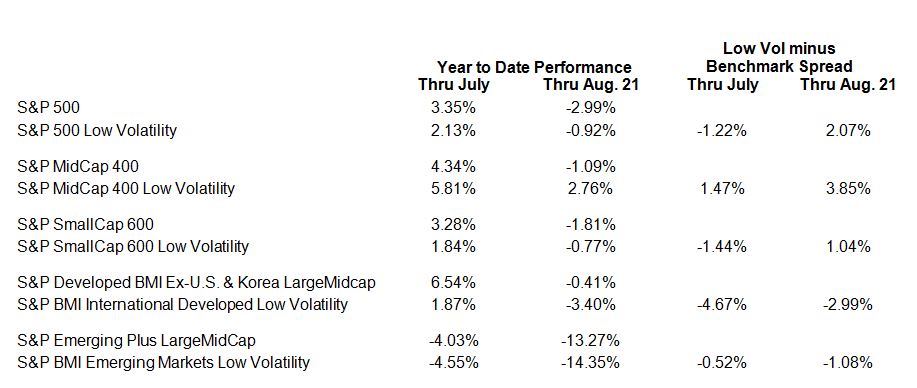
Weak markets tend to make low volatility indices shine. As a strategy that attenuates the performance of the broader market, the S&P 500 Low Volatility Index had lagged the benchmark S&P 500 by 1.22% from the beginning of 2015 thru July 31. As of last Friday, the tide has shifted in favor of low vol. In the U.S., our low volatility indices for large, mid-, and small-cap stocks all outperformed their benchmarks for 2015 through August 21. Abroad, the S&P BMI International Developed Low Volatility Index has done the same.

Below are the summary performance for a few low volatility indices and their benchmarks.

perserverance and low vol


The posts on this blog are opinions, not advice. Please read our Disclaimers.

Contango Costs Oil Investors 10 Extra Years

Contributor Image
Jodie Gunzberg

Former Managing Director, Head of U.S. Equities

S&P Dow Jones Indices

Headline news on Friday was that oil dropped below $40 per barrel, the lowest since March 3, 2009. It’s bad news for an oil investor to learn 6 1/2 years are wiped out – that is no gain since the bottom of the financial crisis.

Unfortunately, the reality is so much worse than that. The price per barrel of oil is an unrealistic measure for most investors since the oil needs to be stored and that can be costly. Futures contracts are priced to include the storage costs, so according to the theory of storage equation, one is indifferent between buying an oil futures contract or buying physical oil and storing it until the time of expiration of the contract. Needless to say, storing at least 1000 barrels of oil is inconvenient, so most investors prefer futures. Sometimes, returns of futures contracts are more profitable than the spot returns and at other times futures lose more than the spot market. Inventories drive the difference where excess inventory that is expensive to store is losing to a futures investor from a curve condition called contango. The opposite condition, called backwardation, is profitable and happens when there is a shortage so there is no value to storage, and a premium, called convenience yield, is put on owning the commodity immediately.

Obviously right now there is excess oil inventory, but how much is being lost from the term structure of futures as described by the theory of storage equation? It might be more than you think. The answer is shown graphically below where the S&P GSCI Crude Oil Total Return includes the term structure costs from rolling but the S&P GSCI Crude Oil does not. With a quick glance, it is clear that 10 additional years of returns are wiped out from these costs.

Source: S&P Dow Jones Indices. Daily data from 1/6/1990 - 8/21/2015.
Source: S&P Dow Jones Indices. Daily data from 1/6/1990 – 8/21/2015.

At Friday’s close, the S&P GSCI Crude Oil index was at 221.69, the lowest since 3/2/2009 when the level was at 220.05, and it fell 62.1% since its high on June 20, 2014. However, the S&P GSCI Crude Oil Total Return fell 66.3% from its June high to a level of 516.55, its lowest since Oct. 11, 1999 when the index was 508.38. Four percent may not seem like much, and although the difference is small from the backwardation that was present through Nov, 2014 (as shown in the chart below,) again, it is enough to erase an additional 10 years of returns.

Two things are interesting. One is that the current rolling costs are currently only about half of what was observed in the drawdown from July 14, 2008 to Feb. 18, 2009. The other interesting observation is that the huge negative rolling costs don’t exactly correlate with the timing of the drawdowns. It was really in Jan and Feb of 2009, that the roll cost spiked with a 33.5% loss in the total return versus a 10.0% loss in the spot return. It took the inventories over 4 years to deplete with no significant shortage for roughly 6 years as shown in the chart below:

Source: S&P Dow Jones Indices.

It is difficult to predict how long this glut will last. However, It may be longer than expected if China decides to use some oil from its (unkown) strategic petroleum reserve as prices rise, and its devalued yuan makes it more expensive to import the oil.

To add to the turmoil, on average when oil is down, it drops 6.9% in a negative month. Historically, gas falls about the same amount, losing 7.0% in a negative oil month. This time unleaded gasoline has held its value relatively well, only dropping about 1/4 of the drop in oil, reducing the benefit to consumers.

From processing issues to labor costs, despite commodity drops, prices seem to be rising for consumers. Check out announcements from: Starbucks about raising prices despite a near 25% drop in coffee this year; the USDA announced rising beef and pork prices despite S&P GSCI Feeder Cattle,  Live Cattle and Lean Hogs losing 8.2%, 12.1% and 22.6%, respectively; some are even reporting bread price increases despite a drop of 14.5% and 21.4% in Chicago and Kansas Wheat. At least chocolate prices are increasing with a the rise in the cocoa commodity price – that is up 5.6% year-to-date. Maybe a little extra serotonin is helping the demand in this otherwise stressful market.

To end this on a sweeter note, many index innovations have been developed to better manage rolling costs from contango. The chart below shows an annualized 10-year comparison of an enhanced rolling strategy that is relatively simple but reduced the loss by half. It also compares a more sophisticated dynamic roll that has lost less than 3%. If diversification and inflation protection are goals, a smarter rolling strategy may be useful for a potentially prolonged term structure in contango.

Rolling


The posts on this blog are opinions, not advice. Please read our Disclaimers.

Tracking Activist Hedge Fund Activities

Contributor Image
Todd Rosenbluth

Director of ETF and Mutual Fund Research

S&P Capital IQ Equity Research

As my S&P Capital IQ colleagues recently noted we have reached a golden age of investor activism. In the past five full years, activist engagements increased fourfold. The success of investor activism has helped these firms both attract more capital and deliver greater returns as their principals now regularly make news and headline events.

The S&P U.S. Activist Interest Index is designed to measure the performance of companies within the S&P U.S. BMI that have been targeted by an activist investor, as defined by S&P Capital IQ, within the last 24 months. The activist must have at least a 5% equity stake, determined through SEC Form 13D filings and the target company must have a minimum three-month average daily value traded of $20 million.

The index launched in April 2015 and as of July 2015 had 67 constituents. The index had 32% in consumer discretionary and 17% in industrials. Some consumer discretionary constituents included Interpublic Companies (IPG) and Crocs (CROX). 

S&P Capital IQ does a quarterly review of the activities of the top-10 hedge funds that collectively manage $200 billion in assets. During the second quarter, the consumer discretionary sector experienced the second most buying activity. The $2.4 billion for the sector was behind only the $7.2 billion for the health care sector.

According to my S&P Capital IQ colleague Pavle Sabic, who published the Hedge Fund Tracker research, among the top 10 top purchases, four companies were in the consumer discretionary sector. They were JD.com (JD), Netflix (NFLX), Amazon.com (AMZN) and Starwood Hotels & Resorts Worldwide (HOT). Meanwhile Rolls Royce (RYCEY) was the lone industrials sector constituent in the top 10.

There are a few ETFs that seek to replicate the holdings of hedge funds.

Please follow me @ToddSPCAPIQ to keep up with the latest ETF Trends

The posts on this blog are opinions, not advice. Please read our Disclaimers.

Probability of Fed Rate Hike in September Rises

Contributor Image
David Blitzer

Former Managing Director and Chairman of the Index Committee

S&P Dow Jones Indices

The FOMC released the minutes of its July 28-29 meeting earlier today.  While there was no discussion of raising the Fed funds target at the July meeting, all agreed that economic conditions are improving and that the labor market is getting stronger. The inflation rate is below the Fed’s 2% target and will be watched closely.  Most members felt that pressures keeping inflation where it is or pushing it lower are abating. No one expected a further sharp drop in oil and energy prices.   Comparing the members’ comments about the economy as it was when they met to more recent releases on GDP, industrial production and housing starts reveal an improving economy.  There appears to be a growing consensus for a move towards raising the fed funds rate.  One member of the committee noted that further increases after the initial move should gradual.

However, all the data aren’t in yet.  The next FOMC meeting is on September 17th. Before then we will see another employment report, another personal income and spending release with the Fed’s preferred inflation indicator, the personal consumption deflator and several other data releases.  FOMC decisions will depend on the upcoming data.

The economy is improving, inflation isn’t falling, the Fed wants to begin normalizing monetary conditions and the policy tools are all in place.  It looks more and more like September will see the first move up 2006.

Those expecting the Fed to delay any move because of the rising US dollar, Greek debts or Chinese stocks were disappointed by the minutes – there were some comments but no suggestion that foreign developments would get top billing and sway Fed policy.

As the chart shows, Its been a long time…

The posts on this blog are opinions, not advice. Please read our Disclaimers.

Asia Fixed Income: Weakening Ringgit Triggered Bond Outflow

Contributor Image
Michele Leung

Former Director, Fixed Income Indices

S&P Dow Jones Indices

Malaysian ringgit continued the plunge and hit a 17-year low.  The offshore holding of Malaysia local government debt also fell with the heightening FX volatility and declining FX reserves.  The S&P Malaysia Bond Index dropped 1.27% in August, bringing year-to-date (YTD) total return to 1.66%. Its broader benchmark, S&P Pan Asia Bond Index, aggregates the returns from 10 countries in Pan Asia and calculated in USD, dropped -0.56% YTD.

Nevertheless, Malaysia has better fundamentals comparing with other Asian countries.  Malaysia has been assigned solid credit ratings of A-/A3/A- . It also released better-than-expected 2Q15 real GDP growth at 4.9% y-o-y.

In fact, the Malaysian bond market almost doubled its size from 2007 to currently MYR 423 billion. Similar to other Asian bond markets, the corporate bond market expanded rapidly from a merely 5% to 15% of the overall market.   Among the corporates, over 90% of exposure belongs to financials sector, with popular names like Malayan Bank, CIMB Bank, Public Bank and RHB Bank.

Looking at the yield performance, the yield-to-maturity tracked by the S&P Malaysia Bond Index has widened 17bps YTD to 4.14%, as of August 18, 2015. The yields of the S&P Malaysia Government Bond Index and S&P Malaysia Corporate Bond Index currently stand at 4.02% and 4.78%, respectively.

Exhibit 1: Market Value

Source: S&P Dow Jones Indices LLC. Data as of August 13, 2015. Past performance is no guarantee of future results. Chart is provided for illustrative purposes and reflects hypothetical historical performance.

Exhibit 2: Yield-to-Maturity

Source: S&P Dow Jones Indices. Data as of August 13, 2015. Charts are provided for illustrative purposes. This chart may reflect hypothetical historical performance. The S&P Malaysia Bond Index and country subindices (the “Index”) were launched on March, 12, 2014. All information presented prior to the launch date is back-tested. Back-tested performance is not actual performance, but is hypothetical. The back-test calculations are based on the same methodology that was in effect when the index was officially launched. Past Performance is no guarantee of future results. Complete index methodology details are available at www.spdji.com.


The posts on this blog are opinions, not advice. Please read our Disclaimers.