According to CNN Money, China’s stock market just lost about $3.25 trillion. That is the equivalent of more than the size of France’s entire stock market, about 60% of Japan’s market, and twice the size of India’s stock market. Despite the seemingly large size, the Chinese stock market still plays a surprisingly small role in China. According to The Economist, “the free-float value of Chinese markets—the amount available for trading—is just about a third of GDP, compared with more than 100% in developed economies. Less than 15% of household financial assets are invested in the stockmarket: which is why soaring shares did little to boost consumption and crashing prices will do little to hurt it. Many stocks were bought on debt, and the unwinding of these loans helps explain why the government has been unable to stop the rout. But this financing is not a systemic risk; it is just about 1.5% of total assets in the banking system.”
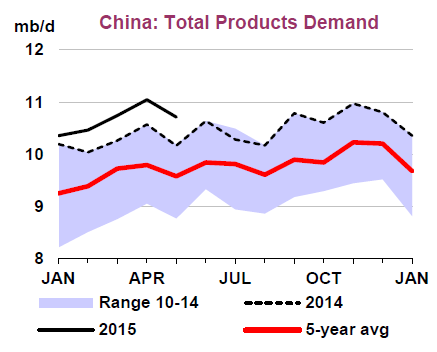
Additionally, according to the latest report by the International Energy Agency (IEA), robust growth has been seen across the Chinese (oil) product spectrum recently with higher-than-expected refinery activity. While the near 3% annual gain foreseen (IEA) for Chinese oil demand in 2015-16 is down from the double-digit percentage point gains seen only a few years back, demand is still 11.13 million barrels per day.
So, forget about China.
However, Greece is delivering a double whammy to oil. The dispute between Greece and European leaders is depressing the euro, and whenever the euro gets depressed, the U.S. dollar gets relatively stronger and commodity markets suffer. While not all commodities fall with a stronger dollar, the five commodities of the petroleum complex have the greatest inverse sensitivity, ranging from -0.62 to -0.67.
If Greece were to exit the euro, any replacement currency it adopts may be severely debased; bringing additional downside pressure to Greek oil product demand as products become more expensive from a stronger U.S. dollar. The IEA cites a recent study of crisis-hit exchange rate regime changes by JPMorgan that concluded that the average depreciation in the first year of trading is between 40% and 80% versus the US dollar. Argentina, for example, saw 70% wiped off the value of the peso in 2002 alongside contractions of 10.9% in GDP and 8.6% of oil product demand. According to the IEA, a similarly sized contraction in Greece in 2016 would remove a further 15 kb/d. That may not seem like much but if Greece’s economic woes spill over into other EU countries, it may curtail oil demand growth across the region, and Europe’s demand is projected by the IEA to be greater than China’s at 13.52 million barrels per day.
Not only is the Greek debt crisis strengthening the U.S. dollar, but the unemployment and frozen banking system is also weakening oil demand. The recent imposition of daily cash withdrawal limits and refusals of credit cards at petrol stations will likely limit access to oil products. In simple terms, if the Greeks can’t pay for gas, there is no demand.
The posts on this blog are opinions, not advice. Please read our Disclaimers.

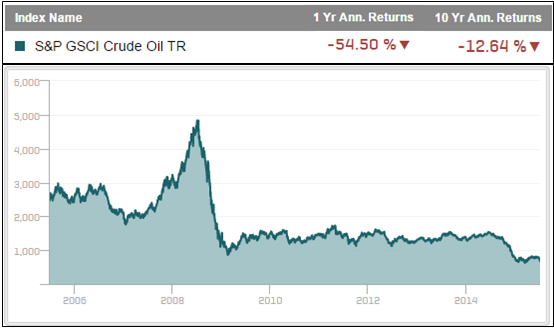
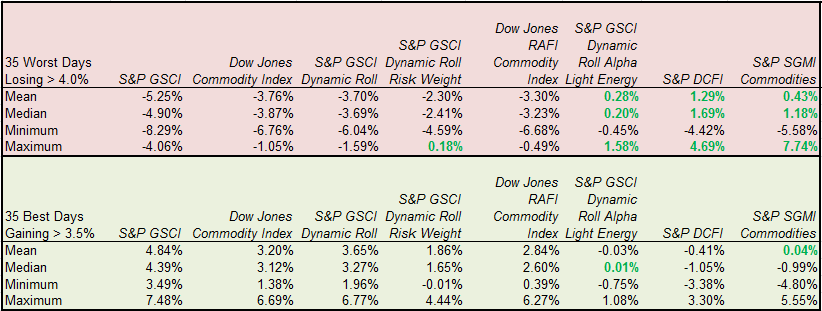 Source: S&P Dow Jones Indices. Ten years of daily data ending July 7, 2015.
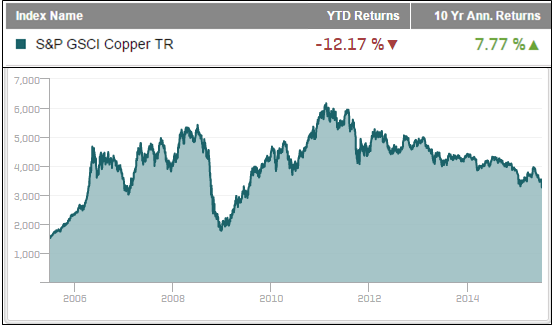