Get Indexology® Blog updates via email.

In This List

European Government Bond Markets Absorb a Lot of Market Info in the First Week of June

Tax-Aware Superannuation – A Closer Look at Dividends

China A-Share Accessibility and Its Impact on Indexing

Bond Yields Move Higher Ahead of Any Fed Rate Decision

OPEC's Decision Might Backfire

European Government Bond Markets Absorb a Lot of Market Info in the First Week of June

Contributor Image
Heather Mcardle

Director, Fixed Income Indices

S&P Dow Jones Indices

European bonds markets had a lot to take in last week.  For the most part, they all responded with a downward price reaction regardless of risk profile, with the exception of Greece.  The ECB left monetary policy unchanged.  Eurozone inflation for May climbed to 0.3%, indicating that QE is having the desired effect.  Greece chose to bundle its June payments to the IMF into one payment scheduled for June 30, 2015, buying them more time to negotiate their debt obligations.  Last, strong employment numbers out of the U.S. pointed to possible Fed rate hikes, which is always a catalyst for a bond market sell-off.

This reaction indicates that, despite continued uncertainty out of Greece, the European bond market is turning away from a “flight to quality” stance.  This could be due to a perception that Greece is on the right track to meet its loan obligations, and/or it could be due to improving economic signs both in Europe and in the U.S.  Spain and Italy, two countries tied to the “risk-on“ trade, also moved down in tandem with the countries associated with the “risk-off”/“flight to quality” trade like Germany.

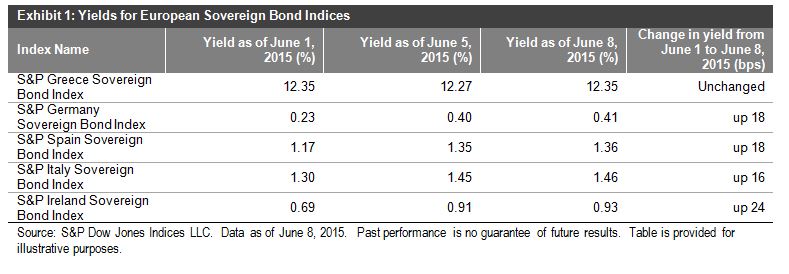
If we look at data from the close of June 1, 2015, to the close of June 8, 2015, yields on most European government bond markets significantly widened (while bond prices went down).  The S&P Germany Sovereign Bond Index and the S&P Spain Sovereign Bond Index both widened 18 bps, the S&P Italy Sovereign Bond Index widened 16 bps, and the S&P Ireland Sovereign Bond Index widened 24 bps, while the S&P Greece Sovereign Bond Index ended unchanged for this period after tightening 8 bps on Friday.

Capture

The posts on this blog are opinions, not advice. Please read our Disclaimers.

Tax-Aware Superannuation – A Closer Look at Dividends

Contributor Image
Harry Chemay

Co-Founder & CEO

Clover.com.au

This is the third blog in a series on the evolution of Australia’s tax-aware investment management (TAIM) landscape.

Large asset owners, including statutory authorities, university endowments, and charitable bodies dominate the Australian investment landscape.  However, the largest asset owners by asset size are the 260-odd superannuation funds who collectively manage some 60% of Australia’s ~AUD 2 trillion pool of retirement savings known as superannuation. Each fund pays tax on taxable contributions made by employers and members, together with income and capital gains earned on investment assets.  Super funds do not, however, pay tax on earnings of assets backing pensions.  In Australia, super funds either pay tax at a notional rate of 15% for working members, or 0% for members in pension mode who are 60 years or older.

What difference do these tax rates have on returns experienced by members? In the case of Australian shares that pay dividends, quite a great deal as the below chart illustrates:

Capture

Members in accumulation (working) mode might incur a tax of between 10% and 15%, or receive an uplift of up to 21% on their Australian shares.  Members over age 60 and in pension mode either have no tax effect or receive an uplift of up to 43% on each dollar of fully-franked dividend attributed them.

Given the low rate of tax paid by superannuation funds, their ability since 2000 to recoup excess franking credits, and the large difference in tax effect between working and pension members, one would assume that super trustees would be among the most tax aware of investment fiduciaries.  However, recent history has painted quite a different picture, which will be discussed in the fourth, blog in this series.

To learn more about how to weigh your after-tax benefits, visit www.spdji.com/tax-aware.

The posts on this blog are opinions, not advice. Please read our Disclaimers.

China A-Share Accessibility and Its Impact on Indexing

Contributor Image
Michael Orzano

Head of Global Exchanges Product Management

S&P Dow Jones Indices

In recent years, Chinese authorities have rapidly accelerated the pace of reforms aimed at making mainland-listed A-shares accessible to foreign investors.  Among other developments, the expansion of the Qualified Foreign Institutional Investor (QFII) quota, the introduction and subsequent expansion of the Renminbi Qualified Foreign Institutional Investor (RQFII) quota, and the launch of the Shanghai-Hong Kong Stock Connect Program have combined to significantly increase market accessibility.

As of May 29, 2015, China represented 31% of the S&P Emerging BMI and 3% of the S&P Global BMI.  However, if China A-shares were represented in full, China would command a weight of approximately 60% in the S&P Emerging BMI and 10% in the S&P Global BMI, making it the second-largest country behind the United States, globally.

Given the size and importance of China’s equity market, the relaxation of foreign investment restrictions on A-shares is clearly one of the most important factors currently affecting global benchmark design, and it is top-of-mind among many in the investment community.  Because of this, S&P Dow Jones Indices has closely followed evolving regulations and actively consulted with market participants over the past two years regarding their experiences transacting in the market, in order to best assess the practical impact of the various reforms and any resulting effect on our existing benchmarks.  In addition, the increased accessibility to the market has spurred the need for a variety of new indices demanded by different segments of index users.

In the past few years, the pace of new index development has increased substantially in response to demand from market participants with various levels of interest in and access to A-shares.  In November 2013, SPDJI introduced the S&P Total China BMI, which includes both A-shares and offshore listings for those seeking a comprehensive China benchmark.  Then in November 2014, we introduced a parallel version of the S&P Emerging BMI—named the S&P Emerging BMI + China A—for use by investors who are looking for an emerging markets benchmark that includes A-shares.  Concurrently, we launched a variety of key regional indices, such as the S&P Global BMI + China A and the S&P Asia Pacific Emerging BMI + China A, to cater to asset managers incorporating A-shares into their investment process.

The introduction of the Shanghai-Hong Kong Stock Connect program in November 2014 marked an important breakthrough, as it allowed market participants to access a wide array of Shanghai-listed stocks without having to be approved for QFII or RQFII quotas.  Following the introduction of the Stock Connect Program, S&P DJI introduced the S&P Access China A and the S&P Access China A Dividend Opportunities Index.  Each index is based on the universe of mainland-listed shares accessible through the Stock Connect Program.  All eyes are now focused on the launch of the Shenzhen-Hong Kong Stock Connect, which is expected to launch later this year.

S&P DJI has published a variety of Chinese equity indices since the mid-1990s, beginning with the S&P China BMI, a comprehensive benchmark including offshore listings available to global investors, and the Dow Jones China 88 Index, which includes the largest and most-liquid A-shares.  Over the years, we have substantially increased our suite of Chinese equity indices, as asset managers and other market participants have demanded a variety of different benchmarks for the market.  We will continue to monitor closely the evolution of the A-share market and consult with market participants in order to evaluate any necessary modifications to existing benchmarks and to develop innovative new indices covering the Chinese equity market.

The posts on this blog are opinions, not advice. Please read our Disclaimers.

Bond Yields Move Higher Ahead of Any Fed Rate Decision

Contributor Image
Kevin Horan

Former Director, Fixed Income Indices

S&P Dow Jones Indices

The yields of U.S. Treasuries rose 27 basis points last week, as the yield of the S&P/BGCantor Current 10 Year U.S. Treasury Index jumped from 2.13% to 2.40% to close the week (as of June 5, 2015).  The return of the index is down 2.43% for the month and has returned -0.86% YTD.

Following the Treasuries’ lead, the yield of the S&P U.S. Investment Grade Corporate Bond Index widened by 24 bps for the week to 3.14% (as of June 5, 2015).  This brings the yield of the index back up to levels that have not been seen since January 2014.  The return of the index is down 1.61% MTD and 0.53% YTD.

The yield of the S&P U.S. High Yield Corporate Bond Index also widened for the week.  The yield of the index as of Friday, June 5, 2015, rose to 6.38% from 6.11% over the course of a week.  The index has lost 0.79% for the month and has returned 3.98% YTD.

The rise in yield was less pronounced for the S&P/LSTA U.S. Leveraged Loan 100 Index as the index’s yield rose by only 5 bps to close the week at 4.86%.  The index has returned -0.22% for the month and 2.41% YTD.
Yield Table

The posts on this blog are opinions, not advice. Please read our Disclaimers.

OPEC's Decision Might Backfire

Contributor Image
Jodie Gunzberg

Former Managing Director, Head of U.S. Equities

S&P Dow Jones Indices

In light of the decision by OPEC (Organization of the Petroleum Exporting Countries) to maintain its 30 million barrel-a-day production level, the S&P GSCI All Crude lost 4.5% this week, bringing its year-to-date return down to -1.7%, back into negative territory. A status the index has not been able to maintain for more than 3 consecutive days since April 10 – that was 40 days ago.

Chart 1

Source: S&P Dow Jones Indices

This is evidence of the volatility that oil is experiencing right now, as you can see in the chart below. While today’s volatility is not the highest in history, it is now more than 45% – that is significantly higher than the historical average of about 30%.  At this level, it appears, the volatility is too much for investors to bear, so managers are cutting their bets.  Will this drive oil prices even lower than the OPEC supply itself?

Chart 2

Source: S&P Dow Jones Indices. Daily data from Jan. 7, 1987 - June 4, 2015.
Source: S&P Dow Jones Indices. Daily data from Jan. 7, 1987 – June 4, 2015.

The price formation of oil is dependent on volatility as the market tries to stabilize.  What happens as OPEC continues to flood the market from a pure supply and demand standpoint is fairly obvious. Total supply increases, and until production is reduced enough from non-OPEC suppliers and inventories are drawn down or demand increases, the oil price most likely drops. However, the speculators play an extremely important role in production decisions impacting oil supply.

As Hilary Till pointed out in a comment to the FT, the role of a speculator has been debated for decades.  Two of the most well-known research papers on the subject come from Paul Cootner of MIT and Holbrook Working of Stanford in the 1950’s and 60’s. The result of their research says everyone who hedges is a speculator but the risk taking is more specific to different market participants. For example, a producer does not eliminate his risk in the futures market but creates a basis risk that is the difference between the spot and futures price which is more predictable to manage.  This is important since it allows the producer to hold more inventories than would otherwise be possible.

The above explanation is precisely why OPEC’s decision to continue to produce oil can backfire and spike the oil price. One more time, WHY?

As production stays high, the oil price drops, the volatility picks up so investors pull out. If investors pull out, then the oil price might drop more, right? WRONG! 

The supply and demand should be unaffected by commodity futures investing since there is no physical delivery from commodity futures investing. Remember, though, that speculators play an important role in risk transfer. As the volatility spikes, investors no longer are motivated to take the risk (go long futures contracts) of supplying insurance to the producers (who are short the contracts to protect against oil price drops.) The result is a collapse in open interest as shown in the charts below that compare volatility spikes with open interest (they are time period close ups of the above graph):

Chart 3

Source: S&P Dow Jones Indices and Bloomberg. Daily data from May 15, 1987 - June 4, 2015.
Source: S&P Dow Jones Indices and Bloomberg. Daily data from May 15, 1987 – June 4, 2015.

From the charts 2 and 3, one can observe that oil price spikes precede high volatility that causes open interest to collapse. Once investors take risk off the table and open interest collapses, then producers are less motivated to produce and store since insurance is more expensive. Then supply diminishes and the problem of low oil price solves itself as demonstrated in chart 2.

Where are we in this cycle? It appears from the 2015 oil volatility in chart 3 that the open interest has not collapsed yet. This means there may be further increased volatility until more money exits the futures market. OPEC’s decision to continue production may accelerate this exodus. When we finally see open interest collapse, then we may find the bottom of oil prices.

Finally, one tidbit that has been pointed out before is that VIX is the performer during this type of environment of high oil volatility, especially post the global financial crisis. Just this month as oil crossed into negative territory, VIX is up 1.6%.


The posts on this blog are opinions, not advice. Please read our Disclaimers.