Get Indexology® Blog updates via email.

In This List

Despite Rate Increase Chatter, Bonds Are Outperforming

The Empowering Ability to be Selective in Emerging Markets

Biotech Has More Room to Run

Active Share: Not Necessary, and Definitely Not Sufficient

GDP: Getting Difficult to Predict

Despite Rate Increase Chatter, Bonds Are Outperforming

Contributor Image
Kevin Horan

Former Director, Fixed Income Indices

S&P Dow Jones Indices

The yield of the U.S. Treasury 10-year as measured by the S&P/BGCantor Current 10 Year U.S. Treasury Bond Index ended the week 9 basis points as month-over-month CPI was the same as prior and lower than the 0.3% expected level.  A drop in crude oil futures also helped push treasury yields to lower at the close of the week.  The index has returned 0.71% MTD and 3.79% YTD.  Ahead this week the Treasury will be auctioning $18 billion of 5-year TIPS.

The performance of the  S&P U.S. TIPS Index got back on track this past week after negative returns of -0.80% for the week of April 3rd to the 10th, the index has now returned 1.58% MTD and 2.85% YTD.  The 10-year breakeven, an indicator of inflation expectations, is the difference between the nominal yield on a fixed-rate investment and the real yield on an inflation-linked investment of similar maturity.  The level of breakeven between the S&P/BGCantor Current 10 Year U.S. Treasury Index and the S&P 10 Year U.S. TIPS Index is 1.89, 12 bps higher from the 1.77 at the start of the month and 15 bps higher than the start of this year (1.74).

Yields of the Investment grade corporates as measured by the S&P U.S. Investment Grade Corporate Bond Index have tightened this month by 8 bps on average and across the rating scales range between 7 to 10 bps.  The S&P U.S. Issued AAA Investment Grade Corporate Bond Index is the 10 basis point mover whose yield is presently as 2.19% and also leads the rating categories by being 32 bps tighter year-to-date from its starting point of 2.51%.

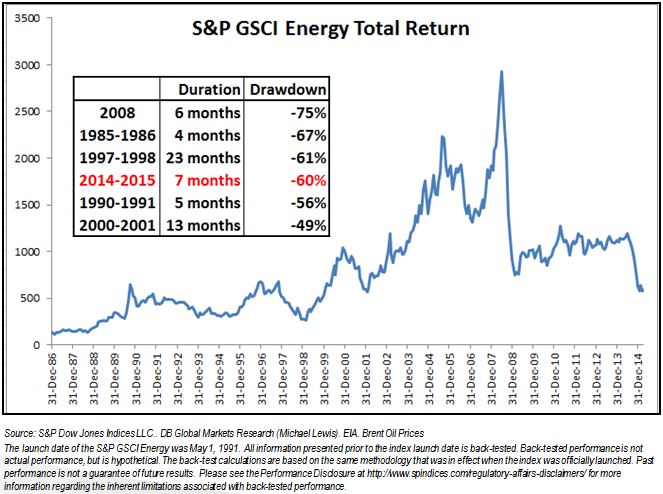
The S&P U.S. Issued High Yield Corporate Bond Index has had quit a ride as the drop in oil price at the end of last year pushed yields as high as 7.23% on December 16, 2014.  Since then the levels dropped to 5.96% in February, bouncing up to 6.36% in March and coming down for a second bounce of 5.98% on April 15th.  The last two days have brought yields up to its current level of 6.03% for April 17, 2015.  The ratings sub-indices of the parent index within the month have seen BB’s 12 bps lower, B’s are 19 bps lower, and CCC & Below are 10 bps higher at 10.19% compared to a start of the month of 10.09%.  The index has returned 1.38% MTD and 4.06% YTD.

The Energy segment of the S&P U.S. Issued High Yield Corporate Bond Index has a market weight of 16% in the index and has returned 2.98% MTD, while Ex-Energy is only at 0.70%.

Senior loans, the secured counterpart to high yield bonds, had returned 0.59% up to April 19, 2015 and 2.45% YTD as measured by the S&P/LSTA U.S. Leveraged Loan 100 Index.  Unlike high yield, the Energy sector is only 2% of the index, the beginning of year drag of this index had more to do with the amount of issuance and the concern over the lack of covenant protections incorporated in the issuance than Energy prices.


Source: S&P Dow Jones Indices: Data as of 4/17/2015, Senior Loan data as of 4/19/2015

The posts on this blog are opinions, not advice. Please read our Disclaimers.

The Empowering Ability to be Selective in Emerging Markets

Contributor Image
Shaun Wurzbach

Managing Director, Head of Commercial Group (North America)

S&P Dow Jones Indices

With a recent webinar on China, an ETF.COM article titled “Global Investors Plan To Shun Emerging Markets” caught my eye.  The article, written by Rachael Ravesz, noted that 29% of the 4,208 investors surveyed by asset manager Legg Mason planned to move money from Emerging Markets into Developed Markets.  The article shared a few reasons why global investors may now be reassessing their views on Emerging Markets including poor performance of the EM benchmark, the impact of oil prices, and a strong US dollar.

It struck me as a very tactical choice to completely shun Emerging Markets.  Our recently published paper on the role that dividends play in Emerging Markets analyzed IMF data from 2014 estimating that Emerging Markets will account for more than half of the world’s GDP by 2019.  Measured by market cap, where Emerging Markets have nearly a 10% weight in our S&P Global BMI index, it still seems a large, negative bet to make.

But financial advisors who are tactical or opportunistic do not need to make an all-or-nothing choice when it comes to Emerging Markets exposure.  Indexing and Exchange Traded Funds measure and provide exposure to regional slices of Emerging Markets or country and sector-based exposures.  Sean Clark, Chief Investment Officer of Clark Capital Management, was a presenter on our recent webinar.  He and I had recently discussed that Clark Capital Management Group had a positive view on Asia Pacific as a region in Emerging Markets and a strong view on China in particular for the following three reasons:

  • Favorable equity valuation (P/E) of the China offshore equity market
  • Historic growth rate of the Chinese economy and expanding manufacturing and service PMI
  • 50 and 200-day moving average / relative strength look attractive to Clark Capital when compared to benchmarks

Sean noted during the webinar that the SPDR ETF tracking the S&P China BMI index had closed in trading up over 6% for the day.  Looking at the country, the region, and Emerging Markets as a benchmark, here is what yesterday and the year-to-date (YTD) looked like:

Index Total return for April 8, 2015 Total Return for YTD (as of April 8th)
S&P Emerging Market BMI 1.74% 6.87%
S&P Asia Pacific EM BMI 2.47% 9.93%
S&P China BMI 6.03% 15.49%

These data show just how empowering it can be to be selective in Emerging Markets.  Our webinar on China was recorded and slides are available for download if you missed it.

The posts on this blog are opinions, not advice. Please read our Disclaimers.

Biotech Has More Room to Run

Contributor Image
Todd Rosenbluth

Director of ETF and Mutual Fund Research

S&P Capital IQ Equity Research

Biotechnology has been one of the best performing industries in the stock market over the past several years. According to S&P Capital IQ, there were numerous catalysts, for this substantial stock outperformance, including several blockbuster drug approvals that drove significant sales and earnings growth. Yet, S&P CIQ thinks the industry’s drivers, including a robust pipeline, remain intact and have a positive fundamental outlook.

S&P Capital IQ equity analyst Jeff Loo expects approximately a dozen drugs to be approved and launched in 2015 with the potential to achieve blockbuster sales levels of more than $1 billion annually by their fifth year after launch (2020). Total sales for the seven biotech companies in the S&P 500 rose 41.5 % in 2014, driven by new drug approvals, and sales growth of 122%. In 2015, our forecasted rate of increase moderates to 13.2%, nonetheless, an impressive rate, in our view. Loo projects gross margin for those seven S&P 500 constituents, to widen to 89.8% in 2015, from 88.6% in 2014.

From January 1, 2011 to December 31, 2014, the S&P 1500 Biotechnology stock index rose 288.5% compared with the 63.6% rise for the S&P Composite 1500. As such, the S&P 1500 biotech industry’s valuation has expanded significantly from 12X forward 12-month EPS in 2011 to 18X in 2014. However, in spite of the significant multiple expansion, biotech’s current 19.1 multiple is equal the health care sector’s PE multiple of forward 12-months EPS and only slightly higher than the broader S&P 1500’s PE multiple of 18X, despite much stronger growth.

Investors have increasingly utilized ETFs in a tactical manner to gain exposure to industries, while benefitting from the ability to make intra-day trades and benefit from their low-cost, passive nature. In 2014, $41 billion was added to all sector ETFs, with nearly $6.4 billion in health care securities. In the first two months of 2015, health care products added an additional $3.0 billion of fresh money.

S&P Capital IQ has research and rankings on a number of ETFs that have meaningful exposure to the biotech industry. Visit http://trymsatoday.com/ to see the full article and/or view our ETF reports.
————————————————————————————————————————————–
S&P Dow Jones Indices is an independent provider of global indices, data and research and receives compensation for licensing its indices and other services to third parties. S&P Dow Indices does not sponsor, endorse, sell or promote any investment product or fund, nor make any investment recommendations. The views and opinions of any third party contributor are his/her own and may not necessarily represent the views or opinions of S&P Dow Jones Indices or any of its affiliates.


The posts on this blog are opinions, not advice. Please read our Disclaimers.

Active Share: Not Necessary, and Definitely Not Sufficient

Contributor Image
Craig Lazzara

Former Managing Director, Index Investment Strategy

S&P Dow Jones Indices

The concept of active share was introduced several years ago as a measure of the degree to which a portfolio of stocks differs from its benchmark.  One of the intriguing results of the initial research on active share was that high active share managers seemed more likely to outperform than low active share managers.  This led, predictably enough, to a widespread belief that if active management wasn’t “working,” the solution was to be more aggressive, or as it was often expressed, to invest with more conviction.

At a basic level, there’s some obvious truth in this claim.  A manager with very low active share makes very small deviations from his benchmark index, and so can hardly be expected to generate large excess returns.  Similarly, a manager with high active share makes large deviations from his benchmark, which might lead to large differences in performance.  The difficulty is that those differences are no more likely to be positive than negative.

Consider: can an underperforming manager (of which there were plenty last year) improve his results by randomly selling half of his names, thus holding a more concentrated portfolio?  Doing so will increase active share for sure.  Is there any reason to believe that it will improve performance?  Of course not — which means that logically, it cannot be true that raising active share will enhance performance.  In that sense, high active share may be necessary, but it is clearly not sufficient.

Researchers at AQR Capital Management have recently argued that high active share is not necessary to produce attractive results.  Moreover, they show that the initial suggestion of a relationship between high active share and benchmark outperformance is due to a quirk in the data.  (High active share managers tended to be small cap managers, and small cap benchmarks had negative alphas relative to the entire equity market.  The high active share managers looked good because their benchmarks looked bad.)  Properly adjusted, AQR concludes that “there is no evidence you’re more likely to be right just because you have a high conviction.”

This in no sense eliminates the usefulness of the active share concept — it’s a handy cross-sectional measure of a manager’s aggressiveness.  It can help us frame reasonable expectations about differential performance.  What it can’t do is tell us whether those performance differentials will be positive or negative.  In the search for alpha, high active share may not be necessary, and is definitely not sufficient.

The posts on this blog are opinions, not advice. Please read our Disclaimers.

GDP: Getting Difficult to Predict

Contributor Image
Jodie Gunzberg

Former Managing Director, Head of U.S. Equities

S&P Dow Jones Indices

In the past 12 months, the S&P GSCI All Crude has lost almost 50% and has moved to the forefront of macroeconomic forces impacting the global economy. In the context of history, today’s oil price drop is not unprecedented in magnitude or duration as you can see in the chart below.GDP Energy history

In fact, there has been a comparable oil price drop every five ten years that could be blamed on a demand crisis or a flood of supply – or some combination of the two. The gold:oil ratio that represents how many barrels of oil it takes to buy an ounce of gold is also telling a story about a supply driven drop. The very high gold:oil ratio now is clearly driven by the oil drop whereas gold has maintained its value. If oil prices remain low versus gold for an extended period of time, as was the case in the 1986 period, the elevated gold:oil ratio may indicate that the energy production boom (whether U.S. or Saudi Arabia) is much more responsible for oil’s price collapse than fears of global deflation, lack of demand, and recession.

Back then, oil prices had been stable at historically high levels of $30/bbl for nearly three years from 1983-1985 that resulted in weak demand and strong non-OPEC production growth. That drove OPEC to flood the market with oil in order to maintain market share rather than support prices. The result was oil prices collapsed to $10/bbl within 8 months. Notice in the graph below that superimposes today’s oil price on the 1985-1986 graph where the pre-crisis shows elevated oil prices to the left of the black line and the drop is to the right of the black line:GDP 86Brent

The similarity is clear and these conditions seem to be in place again today.  The Oil Market Report (OMR) by the International Energy Agency stated oil price pressure in March was due to sharply higher supplies from Middle East OPEC producers, recording its highest month-on-month gain in nearly four years, despite a relentless build in US crude.

The big question that is weighing on analysts is about how the oil price drop is impacting the economy today. A helpful chart by Blackrock shows the incremental GDP impact from oil at $50/bbl as seen below where the green countries benefit and the blue countries lose:GDP 50 Oil

The winners and losers are divided by oil producers, importers and country specific policies. That seems fairly straightforward, but the oil economics are on a slippery slope right now as evidenced by the frequency and magnitude of recent GDP growth forecast changes. In just the first two months of the year Deutsche Bank had already made major changes to its global markets and economic forecasts because the markets were moving much more quickly than anticipated in response to lower oil, deflationary pressures, and a litany of unexpected central bank policy changes. In the chart below, DB illustrates the world GDP growth divided by large oil producers and other countries, and circled in red/green are big downward/upward revisions.DB GDP 2015

Since oil has become a major macroeconomic factor and a key input to support GDP growth, but is currently is hard to predict, GDP growth is also uncertain. Key factors that may influence the oil price going forward are the effects of capital expenditure cuts in 2015, geopolitical risks, possible stagnation in Europe and Japan and production decisions by OPEC. If oil prices stabilize near current levels, then credit risk may increase causing assets to shift based on Fed actions like in the risk-on risk off environment post the global financial crisis. Given our economy is still in a post-global financial transition, it is highly sensitive to these factors.

According to the OMR, recent developments may drive more uncertainty about the supply and demand responses. Stronger-than-expected 1Q15 demand might signal a faster recovery – as would a faster-than-expected decline in North American unconventional supply. However, there may be a slower recovery if pockets of demand strength prove short-lived and lead to weaker deliveries later on. Geopolitics further call into question past working assumptions on future output, but may already have encouraged some producers to hike supply to stake out market share ahead of possible lifting sanctions. All in all, that suggests the market rebalancing may still be in its early stage.

One area of agreement in a world divided by oil importers, exporters, developed and emerging countries is there is an opportunity for energy reform from the oil price drop despite policy differences. Oil importers may benefit from the savings from the removal of energy subsidies that may be used to lower budget deficits and to increase public infrastructure. Developed economies may enjoy a boost to demand from the oil price drop but more monetary policy may be needed to prevent real interest rates from rising, especially if there are further declines in inflation. Infrastructure investment may help the need to support the recovery and long-term growth in these countries. On the other hand, macroeconomic policy to support growth remains limited in emerging markets, but in some cases, lower oil prices may alleviate inflation pressure and external vulnerabilities, thereby allowing central banks not to raise policy interest rates or to raise them more gradually. Some oil exporters may need to strengthen their monetary frameworks to avert the possibility that depreciation will lead to persistently higher inflation and further depreciation.


The posts on this blog are opinions, not advice. Please read our Disclaimers.