Get Indexology® Blog updates via email.

In This List

Don’t Worry About the Fed

So Which Is It?

Deflation

Energy Bonds Are Now One of the Riskiest Sectors

A Strong U.S. Dollar Isn't Bad For All Commodities

Don’t Worry About the Fed

Contributor Image
David Blitzer

Former Managing Director and Chairman of the Index Committee

S&P Dow Jones Indices

Money is often described has having four functions: store of value, unit of account, medium of exchange and a source of anxiety.  Investors reading about the FOMC minutes published earlier this week are focused exclusively on the last function worrying about what will happen when the Fed raises interest rates.  A glance at the last two times the Fed shifted from easing to raising rates suggests that these fears are misplaced.  As Boston Fed President Eric Rosengren explained in a speech this week, even with some unusual market conditions, the Fed’s shift shouldn’t send markets into turmoil.

The last two Fed tightening moves began in February, 1994 and in June 2004.  Both were taken in stride in the economy, the stock market and the foreign exchange markets.  The move in February, 1994 was a bit more of a surprise than the 2004 shift. Moreover, in 1994 most Fed Watchers expected the Fed to move slowly and raise the Fed funds rate gradually over several quarters. However the central bank moved more quickly and the faster pace created some disturbance in the mortgage backed securities market.  At the same time technology stocks began a five year bull run of mythical proportions.

The charts show what happened when the Fed began tightening in 1994 and again in 2004.  On each chart the two vertical lines mark the timing of the Fed’s move.  The market where a reaction was expected and did occur is the treasury market. Short rates rose, long rates rose but by less and the spread narrowed.  When the Fed moves next time it is possible that long rates will move quite a bit. The 10 year T-note yield at about 2% is unusually low and any effort to move the markets back to a more normal condition could more than double the yield on the ten year note.

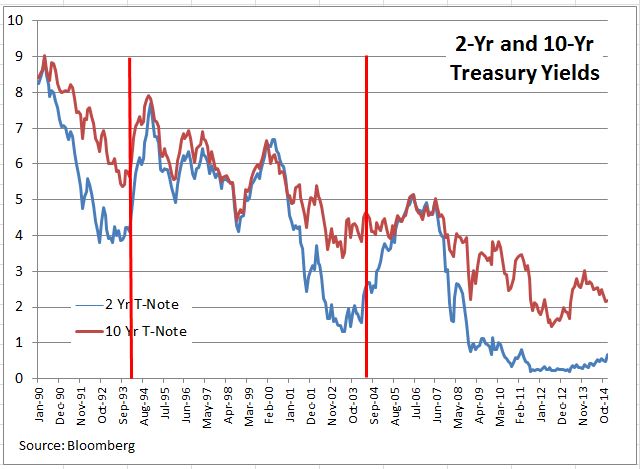
In both 1994 and 2004 the stock market took the move in stride and continued to advance. The 1994 move did see VIX bounce a bit, but neither move led to a bear market. If the next move is being driven by further declines in unemployment and inflation finally touches 2%, the immediate risk to the stock market is likely to be small.

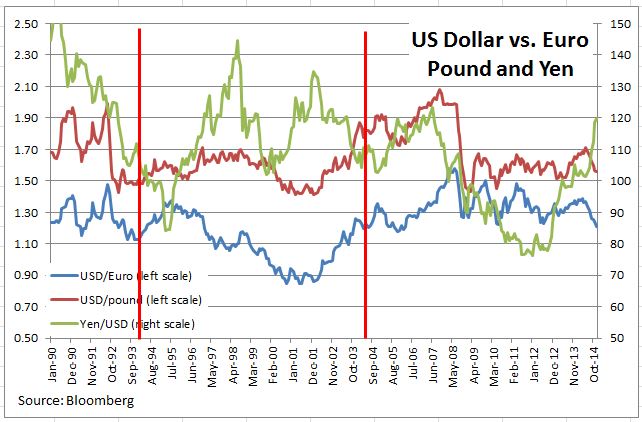
There is some concern at the Fed about how a tightening move may affect foreign economies, especially since they are currently suffering from weaker conditions than in the US. The last chart shows the dollar versus the euro, British pound and the yen.  The Fed’s move isn’t likely to change the dollar’s current strength much. However, higher US interest rates could put upward pressure on some foreign interest rates and raise borrowing costs for foreign economies with dollar-denominated debts.

Lest we banish all anxiety about the Fed, think again.  The initial Fed move isn’t likely to cause massive damage. However, the Fed’s first step will probably be followed by further tightening and the cumulative effect will grow.  For investors the message of the data is not to panic at the Fed’s first tightening move, but not to ignore it either.

The posts on this blog are opinions, not advice. Please read our Disclaimers.

So Which Is It?

Contributor Image
Craig Lazzara

Former Managing Director, Index Investment Strategy

S&P Dow Jones Indices

This morning’s inbox brought the suggestion that “Volatility in equity markets … could be the medicine active managers need to cure their woes…. Increased volatility and rising interest rates should present opportunities for actively managed products relative to indexes that track broad market movements.”  I was particularly struck by this comment because a year ago we were told that falling correlations would be the key to good active performance in 2014.

The problem is that there is a positive relationship between correlation and market volatility.  Other things equal, if correlations rise, volatility will rise, and if correlations fall, volatility will fall.  It cannot logically be that lower correlations (and hence lower volatility) help active managers one year, and that higher volatility (implying higher correlations) helps in the next.  So, an observer is entitled to ask, which is it?

The answer (spoiler alert) is: neither.  The opportunity available to active managers is driven by the market’s dispersion, not by the correlation of the market’s components.  Dispersion measures the average difference between the return of each of an index’s constituents and the index’s return.  High dispersion means a wide gap between the best and worst performers, and lots of opportunity for stock pickers; low dispersion means a narrow gap and less opportunity. The size of the opportunity is important: historically, the gap between better- and worse- performing active managers widens when dispersion goes up.  When dispersion is low, it’s relatively difficult for even a skillful active manager to generate enough excess return to overcome his fees and expenses — and leave any alpha for his clients.

In 2014, dispersion for the S&P 500 (and many other indices) was at or near all-time lows, and active managers were notably unsuccessful in adding value.  Regardless of market volatility, until dispersion rises, most active managers will continue to be challenged.

The posts on this blog are opinions, not advice. Please read our Disclaimers.

Deflation

Contributor Image
David Blitzer

Former Managing Director and Chairman of the Index Committee

S&P Dow Jones Indices

Times have changed: people of a certain age will remember when inflation was investors’ biggest worry, now in Europe the fear is deflation – falling prices.  The chart shows the rate of price change in the Eurozone since 2000. It has been falling steadily for over three years. With the December report out yesterday, prices are now falling.

Deflation now is a slow creeping problem rather than an imminent disaster.  However, as it continues it will squeeze the economy and shift consumer and business attitudes about spending and investment. If not reversed the damage could be long lasting.  Deflation’s principal issues are the impact on debt, on consumer spending and business investment and on the central bank policy.

Deflation with its accompanying economic problems is a negative for stocks and is likely to weaken the euro further.  The only winners are bond holders – providing the bonds are repaid.

Debt deflation – when prices fall any financial instrument denominated dollars and not adjusted for deflation becomes more valuable.  Paying off debts, loans or bonds becomes more difficult as prices fall and their value rises. Businesses cut their prices and revenues fall while the real cost of debt service rises. Only if interest rates could fall below zero could debts adjust for deflation.  Debtors face increasing difficulties and potential borrowers are scared away by the high cost of debt.  Sectors of the economy where growth depends on credit suffer.  Housing would be one of the first hurt.

As prices fall, money becomes more valuable because the same number of dollars buys more.  Incentives to spend or invest whither as consumers and business recognize that it is easier and safer to leave money in the bank and watch it appreciate in value. Over time the economy would gradually grind to a halt.

Deflation is also a challenge for the central bank.  While prices drift down, advice to the European Central Bank (ECB) is mounting higher and higher.  The ECB is expected to implement quantitative easing, but it will face some challenges. First, the supply of bonds is smaller and more diverse than what the Fed bought in the US, making the program harder to implement and its impact harder to gauge. Secondly, Germany may try to block or limit quantitative easing out of fears that it would bailout debtor countries or sow the seeds of future inflation. Hopefully the ECB will move quickly and aggressively – the longer it waits, the worse will be consumer spending and business investment and the harder it will be to make any progress. Even an aggressive QE program may not work in the near term. Chances of successfully reversing deflation and avoiding recession without some fiscal stimulus are limited.


The posts on this blog are opinions, not advice. Please read our Disclaimers.

Energy Bonds Are Now One of the Riskiest Sectors

Contributor Image
J.R. Rieger

Former Head of Fixed Income Indices

S&P Dow Jones Indices

Data as of January 6, 2015

As oil prices have tumbled, the cost of buying default protection on the debt of energy companies has skyrocketed.  The cost of buying default protection tracked in the S&P/ISDA CDS U.S. Energy Select 10 Index has nearly tripled from a low point in June 2014.  As a result, default spreads for the energy sector are now higher than spreads for junk bonds indicating the energy sector is one of the riskiest sectors in the bond markets.

The S&P/ISDA CDS U.S. Energy Select 10 Index ended at 377bps up from 130bps in June 2014.  Translated into dollars, the annual cost of buying default protection on $10million of debt on these entities has risen from $139,000 to $377,000. The S&P/ISDA CDS U.S. High Yield Index ended at 334bps.

Source: S&P Dow Jones Indices LLC.  Data as of January 6, 2015.
Source: S&P Dow Jones Indices LLC. Data as of January 6, 2015.

The ten companies tracked in the S&P/ISDA CDS U.S. Energy Select 10 Index are:

  • Anadarko Petroleum Corp.
  • Apache Corp
  • Chesapeake Energy Corp.
  • ConocoPhillips
  • Devon Energy Corporation
  • Forest Oil Corp.
  • Halliburton Company
  • Peabody Energy Corporation
  • Valero Energy Corp.
  • Williams Companies, Inc. (The)


The posts on this blog are opinions, not advice. Please read our Disclaimers.

A Strong U.S. Dollar Isn't Bad For All Commodities

Contributor Image
Jodie Gunzberg

Former Managing Director, Head of U.S. Equities

S&P Dow Jones Indices

A strong US dollar is generally bad news for commodities since historically as the U.S dollar strengthens, goods priced in dollars become more expensive for other currencies. The historical negative relationship between the U.S. dollar and the S&P GSCI is shown below.

Source: S&P Dow Jones Indices and Bloomberg. Monthly data from 1/70 - 6/13. Charts and graphs are provided for illustrative purposes only.  Indices are unmanaged statistical composites and their returns do not include payment of any sales charges or fees an investor would pay to purchase the securities the index represents.  Such costs would lower performance.  It is not possible to invest directly in an index.  Past performance is not an indication of future results. The inception date for the S&P GSCI was May 1, 1991, at the market close.  All information presented prior to the index inception date is back-tested. There are inherent limitations associated with back-tested data.
Source: S&P Dow Jones Indices and Bloomberg. Monthly data from 1/70 – 6/13. Charts and graphs are provided for illustrative purposes only. Indices are unmanaged statistical composites and their returns do not include payment of any sales charges or fees an investor would pay to purchase the securities the index represents. Such costs would lower performance. It is not possible to invest directly in an index. Past performance is not an indication of future results. The inception date for the S&P GSCI was May 1, 1991, at the market close. All information presented prior to the index inception date is back-tested. There are inherent limitations associated with back-tested data.

While the broad based indices are negatively correlated with the U.S. dollar, some commodities are more negatively correlated with the US dollar than others.  In the long term, since the inception of each single commodity index, ten commodities have a lower than -0.3 correlation to the U.S. dollar: lead, copper, aluminum, nickel, gold, Kansas wheat, Brent, WTI, unleaded gasoline and gasoil with the lead leading the pack with the biggest negative relationship at -0.52.

Commodity Dollar Inc

When reducing the time period to ten years for all commodities, a different pattern appears. The first observation is that with the exception of feeder cattle, all correlations became more strongly negative.  However, some much more than others. Cocoa, corn, heating oil, WTI, silver, soybeans and unleaded gasoline all has greater than -0.3 decreases in correlation, implying a stronger negative relationship with the U.S. dollar.  The five commodities of the petroleum complex have the greatest inverse sensitivity, ranging from -0.62 to -0.67.  On the other hand, it is not surprising to see zinc, natural gas, live cattle, lean hogs, sugar and feeder cattle with almost no correlation. With the exception of zinc, these commodities are highly sensitive to weather.  Other factors like transportability and the global usage (natural gas is local) may influence the relationship.10 yr USD Commodities


The posts on this blog are opinions, not advice. Please read our Disclaimers.