Get Indexology® Blog updates via email.

In This List

The VIX is at a crossroads - mind the gap.

The Best Offense

What Ails the Market?

Real Yield and a 14% Return … O Canada

Bemoaning Cheap Oil

The VIX is at a crossroads - mind the gap.

Contributor Image
Tim Edwards

Managing Director, Index Investment Strategy

S&P Dow Jones Indices

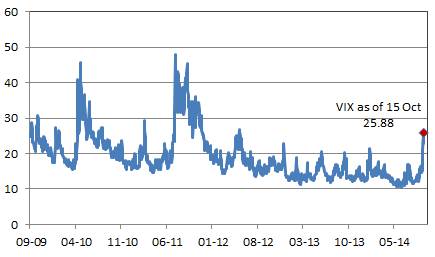
As you, dear patient reader, have no doubt noticed, volatility is back. The VIX® has reached levels not seen since the peak of the Eurozone crisis over two years ago. The exact reasons might be debatable, but either way October is living up to its perennial reputation as the cruelest month for equities.

VIX

Source: CBOE

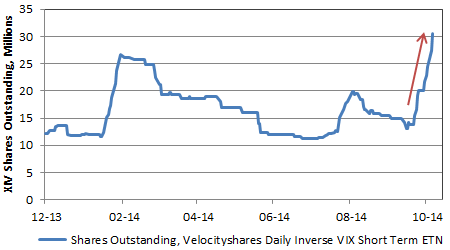
Each time in recent history that the VIX closed above 20, it has rapidly collapsed (see above). And duly following the principle of induction, spikes in volatility are now interpreted as a selling opportunity (in respect of the VIX) by the average punter.  One example of this demand: the largest exchange-traded product providing a short exposure to VIX futures has doubled in shares outstanding in the last few days:

XIVSO

Source: Bloomberg, as of Oct 15th 

Yet volatility levels are not guaranteed to fall. If the U.S. Federal Reserve’s largess was indeed the primary cause of the suppressed levels of volatility seen in the first three quarters of this year, the seat-belts are off. QE3 is expected to end in the next few weeks; history was not kind to equity investors in the periods immediately following the last two rounds:

QE3

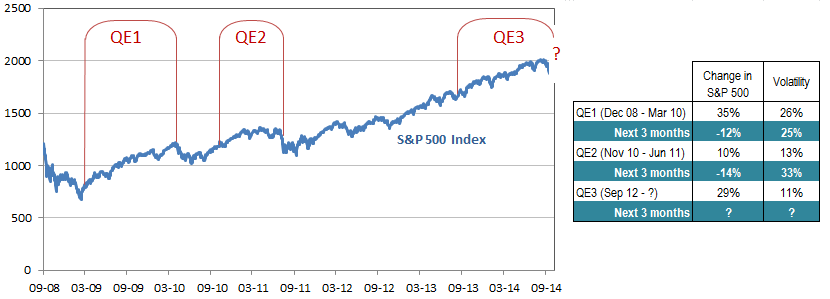
Source: S&P Dow Jones Indices

It requires an unusual degree of foresight, bravery or foolishness to take short positions in the VIX; there are, notoriously, considerable stings in the tail. Moreover, it is a bet framed in terms of death or glory: the VIX rarely resides in the low 20s, instead historically it is brief staging post on the way to crisis or back to recovery.  And despite the enthusiasm for selling volatility at current levels, losses can escalate very quickly if it continues to spike. At some point, those short investors will capitulate; the risk is then a material short squeeze. 

Hypothetically, such a short squeeze would trigger large purchases in volatility futures just as it is already shooting up. A jump from 25 to 35 in such circumstances is not entirely unfeasible. Investors would be wise to mind the gap. 

The posts on this blog are opinions, not advice. Please read our Disclaimers.

The Best Offense

Contributor Image
Craig Lazzara

Former Managing Director, Index Investment Strategy

S&P Dow Jones Indices

Some American football coaches are fond of citing the maxim that the best offense is a good defense — because even if your offense is having an unproductive day, a good defense means that you’re always in the game.

A related principle applies to investing — in some environments, the best way to win is not to lose. The first half of October has been such an environment, as defensive indices, laggards in 2013 and for the first three quarters of 2014, have finally come into their own. The chart below shows how dramatic the reversal of fortune has been:

Index                                               First 3 Qs      October to 10/13         YTD

S&P 500                                             8.34%                  -4.88%                3.06%

S&P 500 Dividend Aristocrats            6.52%                  -2.99%                3.33%

S&P 500 Low Volatility                        7.54%                  -1.46%                5.97%

S&P Dynamic VEQTOR                      4.05%                   0.03%               4.08%

We’ve chosen, admittedly somewhat arbitrarily, only three defensive indices, which achieve their defensive character in different ways. The S&P 500 Dividend Aristocrats Index comprises stocks which have increased their dividends for at least 25 consecutive years, and can be thought of as both a yield and quality play. The S&P 500 Low Volatility Index holds the 100 least volatile stocks in the S&P 500 and tries to exploit the so-called low volatility anomaly. Dynamic VEQTOR is a multi-asset index which owns both the S&P 500 and a long position in VIX index futures.

What these indices have in common is that they offer protection from declining markets and participation in rising markets. We hasten to say that it’s not complete protection and it’s not full participation — they can still lose money when the market goes down (as, indeed, the Aristocrats and Low Vol did in early October), and they will typically lag a rising market (as all three indices did in 2013). But for investors who like the idea of attenuating the downside, and are willing to pay for it by forgoing part of the upside, such defensive indices can provide a very attractive pattern of return.

All three indices lagged their parent S&P 500 through the first three quarters of 2014, all three mitigated the market’s decline during the first 13 days of October, and all three are, perhaps somewhat improbably, ahead of the market on a year-to-date basis. Of course, that tells us nothing at all about the course of future performance. What the first 13 days of October gave, the next 13 could take away.  But in the meantime, investors who opted for a defensive index strategy are getting what they paid for.

The posts on this blog are opinions, not advice. Please read our Disclaimers.

What Ails the Market?

Contributor Image
David Blitzer

Former Managing Director and Chairman of the Index Committee

S&P Dow Jones Indices

Everyone wants an explanation. Cataloged below are popular explanations with each rated as plausible, contributing, possible, or unlikely.

Falling oil prices – bad news for energy stocks but good news for the rest of the economy, especially for consumers.  A few years back everyone was wishing for cheaper gasoline and now that it is almost here we blame it for falling stock market. Contributing

Slow growth in Europe and recession risks in Germany – Europe’s economy is barely growing and near term prospects suggest further weakness. Everyone likes what the European Central Bank says, but no one believes it can provide enough monetary stimulus to make a real difference.  A German recession would hurt the rest of Europe, dampen some of the US economy’s strength and deter some pending tax inversion M&A deals. Plausible

China — In China 7.5% real growth is slow, and it is likely to get slower still. China faces both short term and long term economic challenges and sorting them out won’t happen overnight.  Exports are likely to continue and there will be new cell phone models in 2015, but China may no longer be the buyer of last resort for all natural resources.  The direct impact on the US markets is less than the risk of a European recession, but China is certainly a contributing factor

The end of QE – When the Fed began quantitative easing everyone said it was a mistake. Then everyone said it raised asset prices, including stocks. Now that it is ending, everyone is worried what happens when it goes away.  The announcement and the associated anxiety do more damage than QE itself.  We survived the “Taper Tantrum” last year and will survive the final end of QE, which, by the way, is almost gone. Unlikely

The Fed – Setting aside QE, some investors always blame the Fed, either for what they did, or didn’t do. Over the weekend Stanley Fischer, the Fed Vice-Chairman suggested that economic weakness in Europe and emerging markets might lead the Fed to delay any interest rate increases.  For the moment, the Fed is not the problem. Unlikely

Geopolitics, Ebola, and ISIS – All these worry people and those worries combine with the market worries to encourage selling.  If ISIS were routed, Ebola was only found in bad thriller novels and no one wanted to sanction someone, would a 5% market pullback make the six o’clock news? Plausible

The S&P 500 is falling – Can we blame that market’s decline on the market? One factor cited by market analysts is that the S&P 500 has fallen far enough to test its 200 day moving average.  In research done following the 1987 stock market crash, Robert Shiller asked investors what factors they cited for the market crash; their response was the sharp declines the week before the crash.  Crowd psychology plays a part. The title of one of first analyses of markets and manias was Extraordinary Popular Delusions and the Madness of Crowds.  Contributing


Do we know why the market is down? No. Maybe there isn’t an explanation.  The US economy is doing okay – unemployment is down, inflation is low, there are hints that wages may be rising and the economy is growing.  This is the fourth time this year the S&P 500 dropped about 100 points. The market has successfully forecasted about seven of the last two recessions.  Remember that the market will fluctuate and is virtually unpredictable.

The posts on this blog are opinions, not advice. Please read our Disclaimers.

Real Yield and a 14% Return … O Canada

Contributor Image
Kevin Horan

Former Director, Fixed Income Indices

S&P Dow Jones Indices

The S&P Canada Sovereign Inflation-Linked Bond Index has returned 1.8% month-to-date and an outstanding 14.87% year-to-date.  Investors of inflation-linked bonds are interested in the real yield which measures a bond’s yield adjusted for inflation.  Canadian inflation (2.1%) has recovered in recent months from the low end of the Bank of Canada’s 1% to 3% target range.

Inflation-linked bonds are not just a hold-to-maturity strategy. Inflation expectations vary with economic conditions and so by varying the weightings of nominal and inflation-linked bonds in a portfolio, investors can take views on movements in those expectations.

Currently in Europe, the ECB has been fighting deflationary pressure and looking to revive growth.  U.S. style asset purchases supported by ECB President Mario Draghi are the latest action to stimulating the feeble economy.  Though, strong demand for a new Spanish inflation-linked bond to settle Oct. 14th suggests the belief that the ECB policies will stave off deflation and increase consumer prices.  A modest recovery in inflation might be expected by some as the weak euro versus the dollar could lead to increased price pressures.   Year-to-date the S&P Eurozone Sovereign Inflation-Linked Bond Index has returned 7.06%.

O Canada
O Canada


The posts on this blog are opinions, not advice. Please read our Disclaimers.

Bemoaning Cheap Oil

Contributor Image
David Blitzer

Former Managing Director and Chairman of the Index Committee

S&P Dow Jones Indices

Investors – both stock investors and commodities traders – are having a bad week as oil prices fall lower and lower and the stock market follows close behind.  (see chart 1) In all markets there are buyers and sellers and in the energy market most people (and most equity investors) are buyers.  Cheap energy, especially cheap natural gas, is a boon to the US economy.  Why is oil plunging? Where are the benefits?

Short term factors are behind the current oil price slide: signs of a deeper economic slowdown in Europe and the possibility of a German recession. Added to this are rumors that Saudi Arabia may have lowered prices to maintain its market share plus black market oil sales from some fields in Iraq controlled by ISIS and similar groups.

Larger longer run developments matter more: increased oil and shale oil production in the US and the US natural gas boom.  US oil production has surged, oil imports are collapsing, and cheap natural gas is replacing both coal and oil in electric power generation. Cheap US coal is finding growing export markets in Europe, further lowering global energy prices.  Results cited by the IMF in their just-published World Economic Outlook include rising US manufacturing exports, a smaller US trade deficit and increasing US competitiveness versus Europe and Asia.  While oil price are sending stocks down today, the stage is being set for lower expenses and rising company profits in the near future.

One measure of the impact of increased gas production can be seen in the second chart which shows the prices of oil and natural gas.  Gas is priced per million BTU (a measure of energy) and oil is priced per barrel. A barrel of crude oil contains about six million BTU, so the price of oil should be six times the price of gas. The chart shows oil and gas prices with axes scaled 6:1.  If oil and gas were both traded freely the two lines on the chart would coincide.  However, exporting gas is very expensive, so rapidly growing US gas supplies tend to stay home, keeping gas prices low. On top of that, gas is generally cleaner and requires equipment to use.

To be fair, not all of the stock market gloom should be blamed on energy.  Weak demand in Europe, politics in the Middle East and a bull market that is overdue for some corrective angst are all part of the picture.

The posts on this blog are opinions, not advice. Please read our Disclaimers.