Get Indexology® Blog updates via email.

In This List

Alternative Futures: Fund Management and Indexing

Will This Week’s Upcoming Economic Signals Dampen the Performance of Longer Maturity Investments?

Equity and Credit Markets in Sync?

Sectors: A tale of American Culture

Long and Short of It: Munis Outshine Equities in 2014 as Demand Holds

Alternative Futures: Fund Management and Indexing

Contributor Image
David Blitzer

Former Managing Director and Chairman of the Index Committee

S&P Dow Jones Indices

In the last two weeks two mainstays of the British and global business press – The Economist and the Financial Times have argued strongly that indexing as an investment approach will overtake active management. The Economist (articles here and here) and the FT in its FTfm  section on fund management (here and here) point to the lower fees typically charged for investment products based on indices as the key reason.  It quotes Warren Buffet’s advice to his trustees of his (future) estate to put 10% in cash and 90% in a “very low cost S&P 500 index fund.”  The article cites the growth in index investing’s market share among both individual and institutional investors, citing the continuing strong gains by ETFs as a key driver.  Other contributors to the expanded use of index-based investments are regulations in Britain and other countries abolishing or limiting commissions earned by financial advisors. As asset-based fees replace transaction-based commissions, advisors join with clients in seeking minimal cost approaches.  The increased interest in focused ETFs and “alternative beta” are also encouraging more investors to consider index-based approaches.

In FTfm¸ the FT’s voice on the fund management, an editorial and an article appeared on a report from the UK’s Department for Communities and Local Government arguing that local government pension funds are wasting money on active management fees.

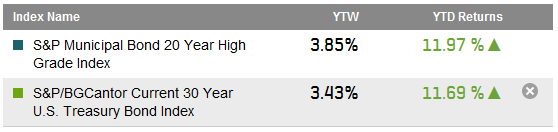
There was a time when either people doubted the numerical evidence that index-based investments and their lower fees tend to out-perform the typical asset manager or simply claimed that no one wanted to be marked as average or ordinary by investing in and index fund.  The data in S&P DJI’s SPIVA reports and other analyses tell the story.  As noted by the Economist, new approaches to indexing are also supporting the growth of index-based investment products.

The posts on this blog are opinions, not advice. Please read our Disclaimers.

Will This Week’s Upcoming Economic Signals Dampen the Performance of Longer Maturity Investments?

Contributor Image
Kevin Horan

Former Director, Fixed Income Indices

S&P Dow Jones Indices

The week ahead should be a busy one with a number of economic indicators scheduled for this week.  Monday starts with a less relevant number, the Treasuries Federal Budget Summary ($106.9bn actual versus $114bn, expected) leading into the more important April Retail Sales (0.4% expected) which after a revision on last month’s number up to 1.2% compared to the expected number could bring some surprise.  Other important indicators of the week will be the MBA Mortgage Applications (5.3% prior), April’s PPI (Producer Price Index, 0.2% expected) and the monthly CPI (Consumer Price Index, 0.3% expected).  Jobless Claims (320k exp.), Industrial Production (unchanged, exp.), Philadelphia Fed Business Outlook (14 exp.), Housing Starts (980k, exp.) and the University of Michigan Confidence Survey (84.5, exp.) all will shed some focus on the strength of the economy and have the potential to surprise the markets.

Last week saw the yield on the 10-year U.S. Treasury unchanged as the yield closed the week at a 2.59% as measured by the S&P/BGCantor Current 10 Year U.S. Treasury Index.  The long end of the curve has been the top performer as the S&P/BGCantor Current 20+ Year U.S. Treasury Index returns 10.90% YTD.  It remains to be seen if this trend continues after the U.S. curve has flattened by 52 basis points as measured by the yield of the S&P/BGCantor Current 30 Year U.S. Treasury Index.

The duration matched spread to Treasuries or the OAS (Option Adjusted Spread) for both the S&P U.S. Issued Investment Grade Corporate Bond Index and the S&P U.S. Issued High Yield Corporate Bond Index are tighter by 16 and 33 basis points respectively.  For the month of May to date, the OAS for high yield is 4 basis points tighter while investment grades are just wider by 2 basis points.  As for their total rate of return performance, these indices are close month-to-date as investment grade returned 0.31% and high yield is at 0.34%.  Year-to-date, the investment grade is still outperforming high yield by returning 4.39% versus 4.01%.

The loan market continued to maintain a healthier tone from last week relative to earlier in the start of the year.  The S&P/LSTA U.S. Leveraged Loan 100 Index has returned 0.29% month-to-date and 1.42% year-to-date.  Bankers indicate a busy pace again this week, with a number of energy-related offerings planned alongside industrial and media deals.

Preferreds continued their run as the S&P U.S. Preferred Stock Index [TR] returned 0.15% for the week.  Month-to-date this index returned 0.37% and is a standout with a year-to-date return of 9.32%.


Source: S&P Dow Jones Indices, Data as of 5/9/2014, Leveraged Loan data as of 5/11/2014.

The posts on this blog are opinions, not advice. Please read our Disclaimers.

Equity and Credit Markets in Sync?

Contributor Image
J.R. Rieger

Former Head of Fixed Income Indices

S&P Dow Jones Indices

The companies in the S&P 500 that borrow the most money are enjoying the benefit of a positive credit market.  The cost of buying default protection on the largest bond market borrowers in the S&P 500 is tracked by the S&P/ISDA U.S. 150 Credit Spread Index and has fallen to lows which can be an indicator of strength for the equity markets.  The cost of buying default protection on $100,000 par value of bonds issued by these companies has dropped from $890 (89bps) on December 31 2012 to $490 (49bps) as of May 9, 2014.

Source: S&P Dow Jones Indices, LLC. Data as of May 9, 2014.

In the recent blog  Sectors: A Tale of American Culture   sectors and their weights are discussed in some detail. The financials sector represents approximately 16% of the S&P 500.  Using that sector as an example, the change in credit spreads of the S&P/ISDA U.S. Financial 30 Credit Spread Index has dropped significantly over the last 16 months.  This is reflecting that the credit markets perspective has turned incrementally more positive with credit spreads dropping from 125bps on December 31, 2012 to 59bps on May 9, 2014.

Source: S&P Dow Jones Indices, LLC. Data as of May 9, 2014.

The posts on this blog are opinions, not advice. Please read our Disclaimers.

Sectors: A tale of American Culture

Contributor Image
Howard Silverblatt

Senior Index Analyst, Product Management

S&P Dow Jones Indices

The makeup of the S&P 500 reflects the U.S. overall big-cap public market, and while it’s relevance to investing is well known, it is also a reflection on the changes in U.S. culture. Last December Facebook was added to the S&P 500, signaling the importance of social media. The prior month J.C. Penney was removed, signaling the end of traditional ‘mail order’ houses (Sears, Montgomery Ward, Woolworth), as the new ‘mail order’ houses, such as Amazon.com and to some degree negotiated mail order issue eBay took their business place. In 2012, Apple started to pay a dividend, propelling Information Technology to become the largest dividend payer (who would have tunk it), just as Apple’s price move had helped the sector maintained its position as the largest sector in the index. And in December 2010, The New York Times was removed from the S&P 500, in what many saw as signaling that print products no longer needed representation in the big caps – as the issue was added to the S&P MidCap 400; Eastman Kodak – one of the original S&P 500 and nifty-50 issues was also moved to the S&P MidCap. On a higher level, from the end of 1989, the shift has been to Health Care, as Americans live longer, and spend more to do so; the Finance sector saw financial institutions grow and try to become ‘one-shop’ centers, as retirement responsibility was shifted to individuals from institutions (as health care is now doing), and investing, insurance, and ‘planning’ has grown; and of course Information Technology, to which the capabilities of my smart phone overpowers rooms of computers from when I used key-punch cards in college (I still have some in the office, along with a few 5” floppies, and an epcdic 6250 tape). Down over the period, partially because of the faster pace of the growth of the former three, is materials, which is partially due to the shift in global operations (this is a U.S. index, even though foreign sales for the S&P 500 are approaching 50%). Consumer groups have declined, partially due lower market values, inspired by lower margins and profits (again, global shifts in production play a key issue). However, the largest decline is in the Industrial sector, where the share of ‘made in the U.S.A.’ and ‘look for the union label’ has declined – which is a commentary in and of itself. Not seen in the sectors is Transportation, which declined so much it was moved from a major group (there were four originally: industrials, transportation, financials, and utilities) to a sub-group within Industrials. And while I’m on sectors, let me note that most investors don’t realize how small energy is – at 10.6% of the index it ranks 6th in market value of the 10 sectors. That wasn’t always the situation. Energy, for a very brief period in July 2008 was the largest sector under GICS (then Information Technology and Financials). And if I go back to my Stock Guide days (where I started), and construct proforma groups, the 1980 representation for Energy is 28.7%, with financials and the equivalent of Information Technology being a lot smaller.

pic12

As for those die-hard capitalists who denounce sentimental retrospectives (although there is always money in sentimental retrospectives – just ask the movie industry), here are the hard, cold prices. News reports typically focus on short-term gains, sometimes the big winner for the day, then at month-end, quarter-end and year-end. The news follows the ‘glory’ of the win, quick money, and playing the long-shot. However, many investors are long-term and not home-run hitter, and they measure their numbers over years and decades. Long-term investing has different characteristics. For that time period dividends count significantly, since they pay every year – in good markets and bad (cash-flow is up there in importance), and when compounded can change the return (and therefore the rick-reward trade-off) significantly. To illustrate, utilities are generally considered slower, but steadier growth investments, paying dividends as they go; they typically (and there are lots of non-typicals out there) attracts income seekers and those wishing lower risk and lower volatility. Since 1989 utilities have returned 3.03% compounded annually, but with dividends added back in, they have returned 7.85% – lower than the S&P 500’s 7.10% stock return, but closer to the 9.41% with dividends (which is a risk-reward trade-off). Information Technology, a sector known for higher risk, has returned 9.51% in stock, and slightly higher with their lower dividends – 10.49%. The difference in breakdown is significant, but so is the risk, with each investor deciding their own trade-off. Sector investor is also popular for long-term trends, where investors believe certain groups will need to survive and prosper over time. Health Care, which is up 11.66% with dividends (the best of any sector) and energy, which is up 11.59% are examples.

pic13

The posts on this blog are opinions, not advice. Please read our Disclaimers.

Long and Short of It: Munis Outshine Equities in 2014 as Demand Holds

Contributor Image
J.R. Rieger

Former Head of Fixed Income Indices

S&P Dow Jones Indices

Demand for munis continues to outpace supply and the result is the muni market is reflecting strength from the five year maturity range on out.  On the shorter end of the curve, five year non-callable municipal bonds tracked in the S&P AMT-Free Municipal Series 2019 Index have returned 2.19% just about where the S&P 500 TR is.  In the intermediate part of the curve, seven year non-callable municipal bonds tracked in the S&P AMT-Free Municipal Series 2021 Index have outpaced the equity market by returning 4.41% with yields dropping by 33bps this year.  Slightly longer bonds in the nine year range maturing in 2023 have returned over 6.2% year to date with yields of the bonds tracked in the S&P AMT-Free Municipal Bond 2023 Index dropping by 79bps.

The long end of the bond market continues to enjoy double digit returns.  The S&P Municipal Bond 20 Year High Grade Index has returned just under 12% year to date with yields dropping by 70bps on the year.

In the high yield arena, the S&P Municipal Bond High Yield Index has returned 8.16% year to date more than double the return of its corporate counterpart, the S&P U.S. Issued High Yield Corporate Bond index, which has returned 3.99% year to date.

Keeping an eye on bonds from Puerto Rico, the S&P Municipal Bond Puerto Rico General Obligation Index has returned 12.26% year to date helping to offset a 2013 decline of over 20%.

Source: S&P Dow Jones Indices LLC.  Data as of May 8, 2014.
Source: S&P Dow Jones Indices LLC. Data as of May 8, 2014.
Source: S&P Dow Jones Indices LLC.  Data as of May 8, 2014.
Source: S&P Dow Jones Indices LLC. Data as of May 8, 2014.

The posts on this blog are opinions, not advice. Please read our Disclaimers.