The week ahead should be a busy one with a number of economic indicators scheduled for this week. Monday starts with a less relevant number, the Treasuries Federal Budget Summary ($106.9bn actual versus $114bn, expected) leading into the more important April Retail Sales (0.4% expected) which after a revision on last month’s number up to 1.2% compared to the expected number could bring some surprise. Other important indicators of the week will be the MBA Mortgage Applications (5.3% prior), April’s PPI (Producer Price Index, 0.2% expected) and the monthly CPI (Consumer Price Index, 0.3% expected). Jobless Claims (320k exp.), Industrial Production (unchanged, exp.), Philadelphia Fed Business Outlook (14 exp.), Housing Starts (980k, exp.) and the University of Michigan Confidence Survey (84.5, exp.) all will shed some focus on the strength of the economy and have the potential to surprise the markets.
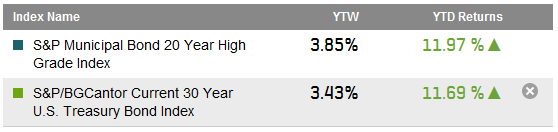
Last week saw the yield on the 10-year U.S. Treasury unchanged as the yield closed the week at a 2.59% as measured by the S&P/BGCantor Current 10 Year U.S. Treasury Index. The long end of the curve has been the top performer as the S&P/BGCantor Current 20+ Year U.S. Treasury Index returns 10.90% YTD. It remains to be seen if this trend continues after the U.S. curve has flattened by 52 basis points as measured by the yield of the S&P/BGCantor Current 30 Year U.S. Treasury Index.
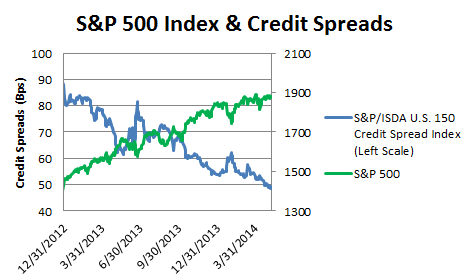
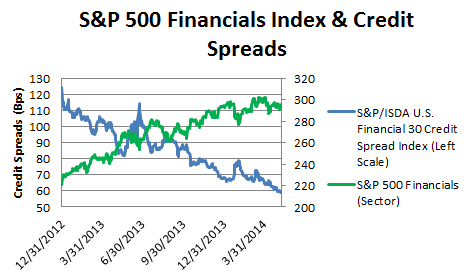
The duration matched spread to Treasuries or the OAS (Option Adjusted Spread) for both the S&P U.S. Issued Investment Grade Corporate Bond Index and the S&P U.S. Issued High Yield Corporate Bond Index are tighter by 16 and 33 basis points respectively. For the month of May to date, the OAS for high yield is 4 basis points tighter while investment grades are just wider by 2 basis points. As for their total rate of return performance, these indices are close month-to-date as investment grade returned 0.31% and high yield is at 0.34%. Year-to-date, the investment grade is still outperforming high yield by returning 4.39% versus 4.01%.
The loan market continued to maintain a healthier tone from last week relative to earlier in the start of the year. The S&P/LSTA U.S. Leveraged Loan 100 Index has returned 0.29% month-to-date and 1.42% year-to-date. Bankers indicate a busy pace again this week, with a number of energy-related offerings planned alongside industrial and media deals.
Preferreds continued their run as the S&P U.S. Preferred Stock Index [TR] returned 0.15% for the week. Month-to-date this index returned 0.37% and is a standout with a year-to-date return of 9.32%.
Source: S&P Dow Jones Indices, Data as of 5/9/2014, Leveraged Loan data as of 5/11/2014.
The posts on this blog are opinions, not advice. Please read our Disclaimers.