Get Indexology® Blog updates via email.

In This List

The U.S. Congress and Investors Await Janet Yellen Comments

Emerging Markets: Don't Panic!

Re-Read Friday’s Employment Report

Chinese New Year: Element of Wood

Inside the S&P 500: PE and Earnings Per Share

The U.S. Congress and Investors Await Janet Yellen Comments

Contributor Image
Kevin Horan

Former Director, Fixed Income Indices

S&P Dow Jones Indices

  • The S&P/BGCantor U.S. Treasury Bond Index finished last week slightly down -0.02% after the market traded up at the end of the week in reaction to the Nonfarm Payroll number. This January indicator of employees on business payrolls (113k) disappointed expectation of 180k giving bond prices an upward push after three days of declines.
  • Treasuries prices are slightly up for the start of the week, Tuesday will open with the new Federal Reserve Chairman, Janet Yellen, presenting to Congress for the first time in her role. The markets will listen to learn more about her thinking and how the Fed will communicate its approach to monetary policy. In addition to a Congressional hearing, economic numbers scheduled for this week such as Wholesale Inventories (0.5% expected), MBA Mortgage Applications (0.4% prior), Retail Sales (0.0% expected), Initial Jobless Claims (330k expected) and the University of Michigan Confidence number (80.4 expected) will all point to if the U.S. economy is continuing to progress forward or stalling.
  • The S&P U.S. Issued Investment Grade Corporate Bond Indexclosed last week up 1.95% year-to-date. On the month, Health Insurers and Health Care Facilities like Ohio National Financial Services and, The City of Hope, and The Mayo Clinic are leading the way. On the downside, Electrical Utilities which account for 6% of the index are down -0.02%.
  • The S&P/LSTA U.S. Leveraged Loan 100 Indexis down -0.04% month-to-date. Names like Laureate Education Inc., TXU Corp., and Cengage Learning have moved this index lower on the month. In high Yield as measured by the S&P U.S. Issued High Yield Corporate Bond Index, the index is up slightly at a 0.22% for the month.  Year-to-date the index is up 0.98%, though investment grade’s year-to-date return of 1.95% is out shining high yield as investors who have been chasing yield move back up the credit rating scale.

Data as of February 7, 2014 | Leverage Loan data as of February 9, 2014


The posts on this blog are opinions, not advice. Please read our Disclaimers.

Emerging Markets: Don't Panic!

Contributor Image
Tim Edwards

Managing Director, Index Investment Strategy

S&P Dow Jones Indices

Currencies and equities across various countries classified as “emerging” have come under increased scrutiny in the past few weeks, with more excitable commentators seeing signs of a crisisShould broad-based index followers be worried? Perhaps not.

On the one hand, the tapering of U.S. quantitative easing has triggered flights of “hot money” from countries (like Turkey) that were deemed overly dependent on U.S. largesse, those subject to political instability (Brazil) and those with potentially systemic local risks (a real-estate bubble and financial liquidity crunch in China).

On the other hand, this is not 1997.  Except for Turkey, the majority of emerging markets have not piled on foreign currency debt, and years of relative underperformance has given rise to attractive valuations compared to the developed world.  Russia – for example* – is trading at a price-to-book ratio of 0.77 and a dividend yield of over 4%.

Considering all such “emerging” markets as equivalent is convenient, but misleading.  Recent sell-offs have been highly discriminatory and selective. The dispersion among stocks and countries within emerging markets is greater than for developed market equities. 

One might think it therefore matters which countries you invest in.  That’s certainly true.  But it also means that there is a strong diversification effect, captured by broad-based indices.  If the risks within emerging markets are particular to each country, the effect of aggregating those risks is highly dilutive.  If you hold a concentrated position in any one country, you might be wise to worry.  If you hold a diversified position across multiple countries, maybe not so much.

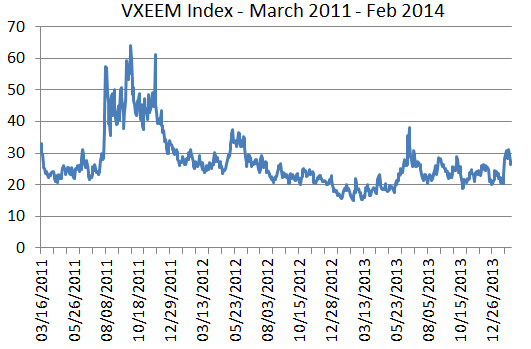
The volatility markets provide a current confirmation.  Recently, the CBOE began publishing implied volatility levels for emerging markets.  Like the VIX® (to which it is related) the VXEEM Index uses the prices of options to estimate how much volatility is predicted by the market – in this case for a broad-based emerging market ETF:

VXEEM

             Source: CBOE, as of February 7th, 2014

Friday’s close of 26.5 is higher than current levels of the VIX; that should be no surprise – emerging markets are usually more volatile than developed markets.  But it is fairly low on a historical basis: implied volatility is just below its three-year average.  The options market is not overly worried about broad-based emerging market exposure: in an environment where the flows of flighty capital can prove decisive, this is useful information.  The balance between fear and greed is not as tilted towards fear as the headlines might suggest.

 _______________________________________________________

* Based on previous 12 month dividends and FY0 book value for S&P Russian Federation BMI. For purposes of comparison, the S&P United States BMI has a dividend yield of 1.8%, and price-to-book ratio of 2.61, as of 31st January, 2014.

The posts on this blog are opinions, not advice. Please read our Disclaimers.

Re-Read Friday’s Employment Report

Contributor Image
David Blitzer

Former Managing Director and Chairman of the Index Committee

S&P Dow Jones Indices

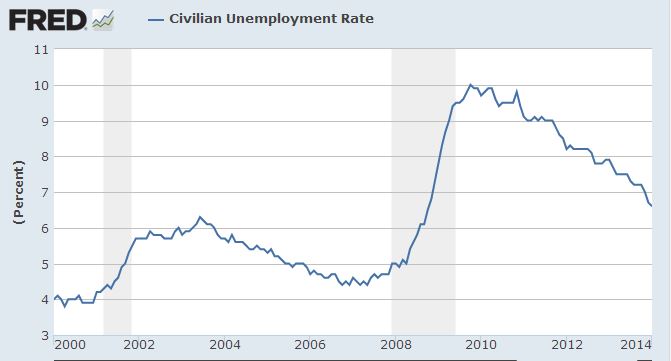
Last Friday’s employment report for January was greeted with groans and sighs.  The weak payrolls number in December was revised upward by only a thousand jobs and the January figure, at 113,000, was a big disappointment.  While the unemployment rate did drop to 6.6% from 6.7%, the change was as small as could be reported and most Wall Street analysts believe that the payrolls number is a far more reliable number anyway.  Neither payrolls nor the unemployment rate should be ignored – they tell different, though hopefully consistent, stories about different elements of the economy.  As weak as the payrolls were, the unemployment rate and the rest of the data from the household survey offer some encouragement.

ruc

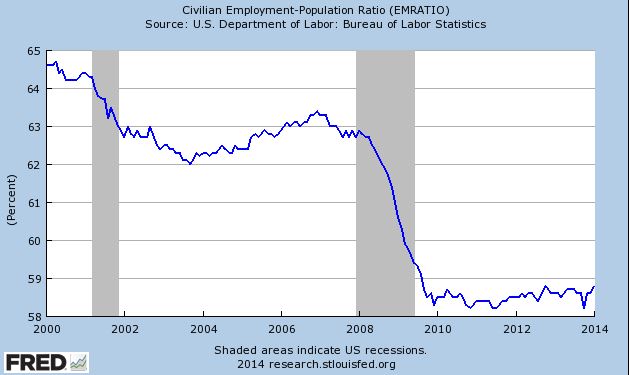
First, the unemployment rate is falling consistently so the small drop of 0.1 percentage points was more likely a real change than random noise.  (see first chart) Second, other data in the household survey are also showing some continuing improvements.  As noted on the Wall Street Journal’s economics blog, the employment-population ratio – the percentage of people working – is creeping up since last fall and reached a new high since the recession ended in 2009.  Many complain the unemployment rate is biased because when people drop out of the labor force, they are not counted as unemployed.  The employment-population ratio counts people even if they drop out. The gains are still small, but appear to be going in the right direction. (see second chart)  On top of these measures, other numbers looked better as well. Labor force participation increased and the number of people working part time because they couldn’t find full time jobs went down. Whether the good news continues remains to be seen, but the trends are encouraging.

emp-pop

Some worry that the Fed may accelerate its tapering or even raise interest rates if the unemployment rate passes 6.5%. Not to worry. The Fed is not likely to move any time soon.  The economy is still weak and inflation is too low, so we are likely to remain at the zero lower bound for awhile longer.

Data for charts are from the US Bureau of Labor Statistics via the St. Louis Federal Reserve Bank’s service, FRED. Data are monthly, January 2000 to January 2014.

The posts on this blog are opinions, not advice. Please read our Disclaimers.

Chinese New Year: Element of Wood

Contributor Image
Jodie Gunzberg

Former Managing Director, Head of U.S. Equities

S&P Dow Jones Indices

In honor of the Chinese New Year, 2014 – Green Wood Horse (馬 午), CCTV interviewed me on lumber.  As for other commodities, The Year of The Horse should be prosperous for lumber, especially for China’s sawmill industry, enabling them to support their construction boom by importing whole logs and sawing them into lumber at a cheaper price than buying the already sawn lumber.

In case you are interested, here is the script:

  1. What’s the Outlook for lumber in 2014? What is important about the lumber prices is that they are potentially more volatile than commodities with more developed futures markets.  Since lumber is more segmented than the key commodities in the global benchmarks, futures as hedging tools are less efficient for producers and consumers. What lumber prices do have in common with more liquid commodities are that once again they are being heavily impacted by supply shocks that drive the returns to be unique from other assets.  This is true for most commodities since the effect of the risk-on risk-off environment from the quantitative easing seems to be diminishing.    
  1. What are the factors influencing the lumber industry? The US housing starts, Chinese urbanization and potential growth from India are strong influences on the demand side of the lumber industry.  However, one of the most impactful changes has been the domestic  sawmill industry developing in China to support its construction boom.  It is cheaper for them to import whole logs and saw it into lumber rather than to import the sawn lumber. While forest land owners have benefitted from the surge in Chinese demand of logs, saw mills and other forest product industries suffered across the world from the Pacific Northwest to Russia. The radically altered global trade flows have created a number of winners and losers in the spectrum of the lumber industry.                                                                                                                                                                                                                          
  2. What are the factors affecting prices?  Possible declining demand from Japan and Canada needs to be offset by growing Chinese and U.S. demand.  US housing starts have a big influence and rising rates may be a big threat to the lumber price.  Many analysts are looking for new housing starts to increase more than 20% or 175,000 units in order for lumber to have a strong year. If global demand can grow roughly 3.5% then that should be supportive of lumber prices and any demand growth beyond 4% should be very favorable.  Further, since commodities have been more sensitive to supply shocks, the beetle impact is notable, although the epidemic seems to be over.

Also, I’ve included a number of links you might find useful on lumber:

http://www.woodworkingnetwork.com/wood/lumber-data-trends/Global-Lumber-Outlook-for-2014-Market-Prospects-Look-Good-239469661.html?page=2#sthash.iNUIzePD.jltWMQwp.dpbs

http://www.westernforestry.org/Events/wp-content/uploads/2013/08/Elstone-new.pdf

http://biomassmagazine.com/blog/article/2014/01/mapping-a-course-for-bioenergy-in-the-pacific-northwest

http://www.woodbusiness.ca/industry-news/global-lumber-outlook-for-2014

http://blogs.wsj.com/developments/2014/01/17/housing-starts-forecast-for-2014-past-is-not-prologue/

http://www.andykerr.net/storage/conservation-uploads/forests/LOP19ORSoftwoodLumberMillingCapacity.pdf

http://news.yahoo.com/india-potentially-strong-market-canadian-lumber-energy-resources-211325825.html

The posts on this blog are opinions, not advice. Please read our Disclaimers.

Inside the S&P 500: PE and Earnings Per Share

Contributor Image
David Blitzer

Former Managing Director and Chairman of the Index Committee

S&P Dow Jones Indices

Two carefully watched numbers are the earnings per share (EPS) and the price-earnings ratio (PE) on the S&P 500.  Their popularity stems from the wide spread use of the index and its long data history.  EPS is the market analysts’ gauge corporate profits in the US while the PE is their measure of value.  While there is a lot of debate over what level of PE is so high one shouldn’t but or so low one should rush into the market, most analysts agree it is a key valuation measure.

EPS-PE

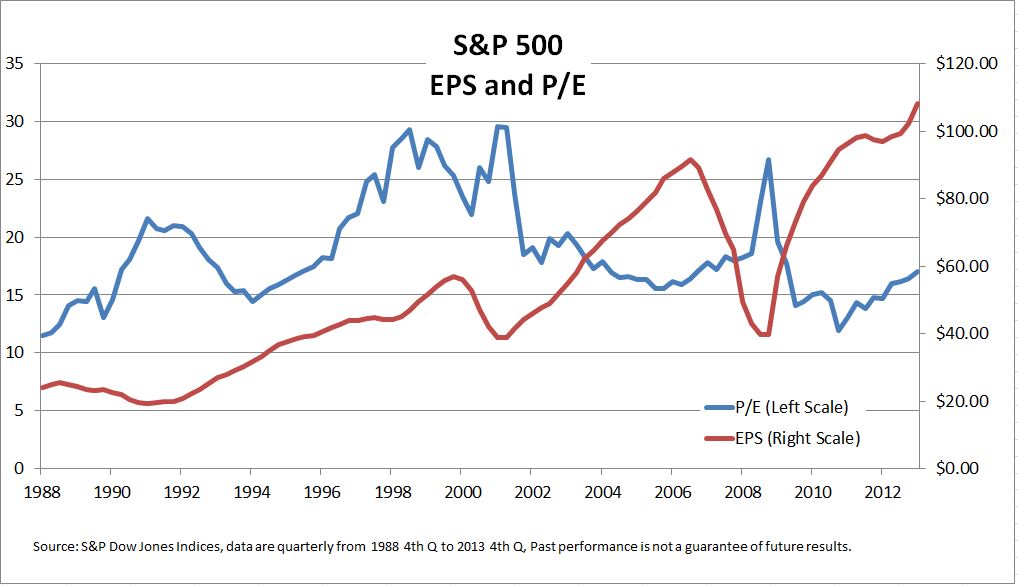
The PE is the ratio of the price of the index to the earnings per share.  The index price, say 1848, can be thought as the price of one “share” of the S&P 500 and the EPS, about $108.00 is the earnings of the companies represented by that share of the index.  There are a few ways to measure the PE, depending on how earnings are measured. Most of the time people use a full year measure instead of one quarter’s earnings because there are seasonal shifts in earnings for some industries.  The key question is whether to measure earnings by the last four quarters of data based on company reports or to be forward looking and measure earnings by analysts’ estimates for the coming year.  While market prices depend in part of people’s expectations of the future, using the recent history – usually called “trailing earnings” —  means using real numbers rather than forecasts. Since earnings usually rise, the PE based on trialing earnings is likely to be a higher number than the PE based on analysts’ estimates of next year’s results.

Calculating the earnings per share for the index is a bit more complicated than the PE. It follows the same approach used to calculate the index itself: the market value of each of the 500 companies is added together giving a total is about $15 trillion today. Then to have a more manageable number for the index level, the $15 trillion is divided by a scale factor called the divisor.  One can think of the divisor as if it were the number of shares outstanding of a company: a company’s stock price is its total market value divided by the number of shares. Likewise, a company’s EPS is its total earnings divided by the number of shares.  The analogy is that the EPS for the S&P 500 is total earnings of the 500 companies, divided by the same divisor used to calculate the index.

The EPS calculation includes earnings of all the companies in the index, including any that lost money.  Counting only positive profits and skipping losses might make for nicer numbers, but it would be market analysis through rose colored glasses. The chart shows both the PE and the EPS for the S&P 500 going back to 1988. The bear markets in 2000-2002 and 2007-2009 stand out: earnings fell sharply.  On both occasions, the PE rose because the proportional drop in earnings was greater than the decline in stock prices.

Neither the PE nor the EPS are infallible guides to the stock market, but both are important measures of how the market is doing.

The posts on this blog are opinions, not advice. Please read our Disclaimers.