Ever since Harry Markowitz published his June 1953 paper on portfolio selection, investors both institutional and retail have subscribed to the theory that diversification – and its use in combination with mean-variance optimized allocations – universally widens and almost always improves the possibilities of risk and return.
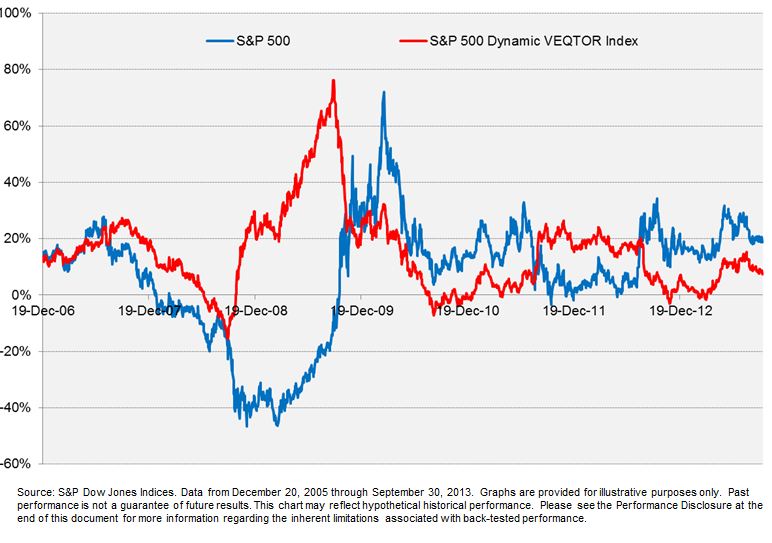
At its core, the theory states that an investor should consider including assets with a) positive return expectations and b) low correlations to existing investments. Faithfull acolytes of Markowitz as many of us have now become, the years subsequent to the financial crisis have challenged if not the theory, then at least the practice of expecting diversification to provide a “free lunch”: macro-economics dominated performance as condition b) above remained persistently obstinate in its absence.
Average strength of multi-asset correlations, based on 12-months returns*.
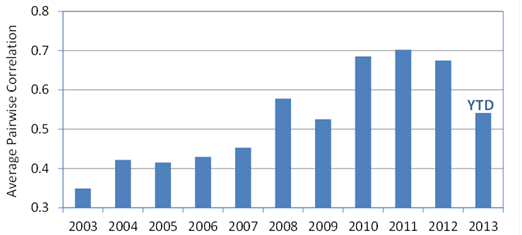
Sources: S&P Dow Jones, Barclays, JP Morgan, HFRI. Charts and graphs are provided for illustrative purposes. Past performance is no guarantee of future results.
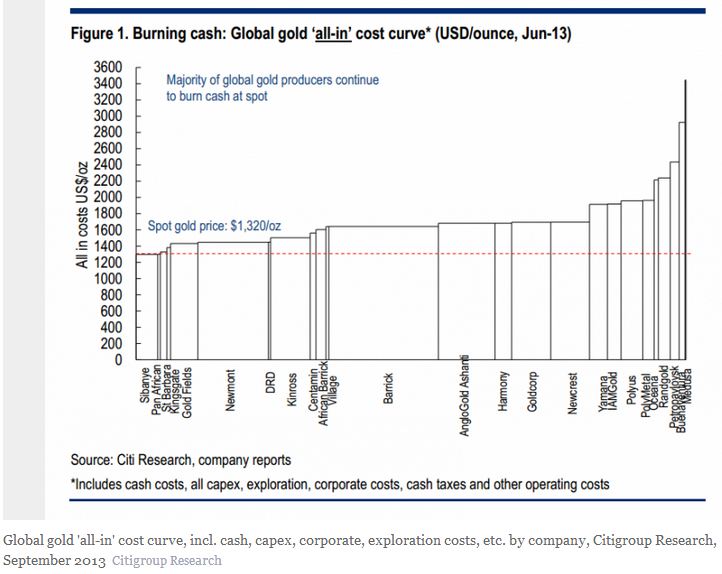
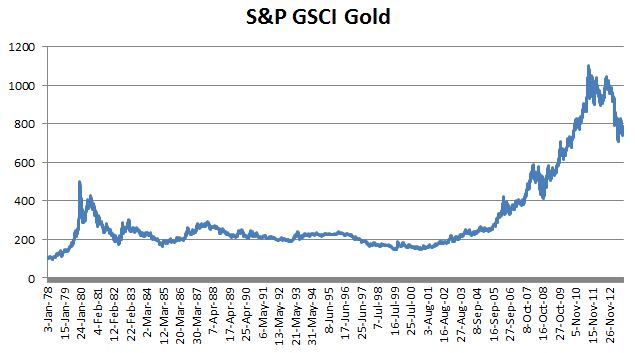
And in due course, the great minds of investment and allocation have bent their efforts into ever-more esoteric assets.
But it’s not just about correlation, which measures the strength of linear relationships. It’s also about differing market betas, and about conditional relationships between financial assets. It’s about how disperse the returns are, this month and next. In an environment of high dispersion, not only does it matter more which allocations you make, it also – at least in theory – implies a greater benefit from diversification. If you’re wondering whether it’s worth expanding your investment footprint beyond a core set of exposures, or even how much difference your decisions really make, that’s a particularly useful concept to keep in mind.
We recently offered some thoughts to define, examine and to some extent publicize dispersion. Not only because we think it’s an under-celebrated and remarkably useful measure of market opportunity, but also because it has much to say about the current diversification of existing portfolios (like the S&P 500®) and – in tandem – can provide a useful guide to the factors that are most important in understanding Index returns.
* Average of absolute values of 12-month correlations between the S&P GSCI Commodities, S&P 500®, S&P Europe 350®, S&P Emerging Market BMI, JP Morgan Core EMBI, Barclays Aggregate U.S. Corporate High Yield, S&P 7-10 year U.S. Treasuries and HFR Global Investable Indices. Note that negative correlations are counted as positive – it is the strength not the sign of the relationship that we wish to emphasize.
The posts on this blog are opinions, not advice. Please read our Disclaimers.