


David Blitzer, Managing Director and Chairman of the Index Committee, answers the question, “What can an index do for me?”
The posts on this blog are opinions, not advice. Please read our Disclaimers.

Explore new territories with greater confidence
S&P DJI combines global reach with local expertise, working with exchanges around the world to build indices for both the local and international investment communities.
For over 20 years, our renowned SPIVA research has measured actively managed funds against their index benchmarks worldwide.
Register to attend complimentary webinars and deepen your knowledge of current trends and issues impacting the index universe today.
Your Gateway to Index Data
Explore new territories with greater confidence
Our Services
Professional Resources
S&P DJI combines global reach with local expertise, working with exchanges around the world to build indices for both the local and international investment communities.
Asset Class
Themes
By Region
Our Exchange Relationships
S&P DJI combines global reach with local expertise, working with exchanges around the world to build indices for both the local and international investment communities.
Equity
Fixed Income
Commodities
Dividends & Factors
Multi-Asset
Other Strategies
Sustainability
Thematics
Digital Assets
Indicators
For over 20 years, our renowned SPIVA research has measured actively managed funds against their index benchmarks worldwide.
Register to attend complimentary webinars and deepen your knowledge of current trends and issues impacting the index universe today.
Research & Insights
Education
Performance Reports
SPIVA®
For over 20 years, our renowned SPIVA research has measured actively managed funds against their index benchmarks worldwide.
Events & Webinars
Register to attend complimentary webinars and deepen your knowledge of current trends and issues impacting the index universe today.
S&P DJI has an extensive history of delivering robust and transparent benchmarks to the financial industry and always endeavors to deliver high quality indices in conformity with our core values and in compliance with all applicable laws and regulations as well as industry standards and guidelines. S&P Global's Code of Business Ethics coupled with S&P DJI policies and procedures set the standard for an effective governance program.
Find out what makes our indices tick—access index policies and methodologies, GICS® structure definitions, rebalancing and holiday schedules, and other information related to index calculation and maintenance.
Governance
Methodologies
Consultations
Our consultations enable members of the investment community to provide feedback on potential changes to index methodologies.
Your Gateway to Index Data
SPICE
Your Gateway to Index Data
S&P Global Offerings
Featured Topics
Featured Products
Events

What can an index do for me?
Q1 Buybacks Slightly Up, But Fewer Shares Repurchased
CPI Rises in May: How much inflation protection have commodities provided?
S&P GSCI Precious Metals Hits Lowest Since October 2010
Fed Meeting Report due tomorrow, Hints Bernanke will step down in January 2014
David Blitzer, Managing Director and Chairman of the Index Committee, answers the question, “What can an index do for me?”
The posts on this blog are opinions, not advice. Please read our Disclaimers.

Q1 Buybacks Slightly Up, But Fewer Shares Repurchased
Breakdown shows a broader participation in share count reduction – but it is slow
Q1,’13 S&P 500 buyback expenditures slightly increased 0.8%, to $100.0B from $99.1B in Q4,’12, and was up 18.6% for Q1,’12 $84.3B (record was Q2,’07 at $172B).
12 months ending Mar,’13 increased 3.8% to $414.6B from the $399.5B posted in the prior 12 month period (12 month high was 2007, at $589.1B)
Companies continued to protect their earnings from dilution due to option execution, however, actual shares repurchased were down, as the 0.8% increase in expenditures failed to keep pace with the 6.8% increase in the average share price for the quarter.
Even with programs and authorizations setting record levels and receiving extensive press coverage, the number of companies moving back to share count reduction is slow, but they are increasing, with 81 issues reducing their share count by at least 1% in Q1 (over Q4,’12), a general measure of share count reduction, as compared to just 36 issues for Q4 2012 (over Q3,’12). In Q1, 328 issues reported share repurchases, up from 317 in Q4, with 212 of them reducing their share count, up from 98 in Q4.
While buybacks remain the instrument of choice to prevent earnings dilution from employee options and dividend reinvestment plans, the first quarter appeared to fall short of the needed shares. Overall shares have slightly increased, as issuance has outpaced repurchases. In the first quarter the overall share count was up, with the Information Technology sector, the leader in buybacks, slightly increasing its overall share count by 0.9%. The Telecommunications Sector, led by AT&T, which has reduced its share count by 6.9% over the last four quarters, reduced its overall share count by 3.5%.
The Information Technology Sector held its position as the largest repurchaser, spending $17.5B, which was down from the $22.7B spent in Q4.
The Health Care Sector was right behind IT, as it increased to $16.8B from $11.4B, with Telecommunications increasing from $4.4B in Q4,’12 to $6.5B in Q1.
AT&T led with a $5.9B expenditure (up from $4.4B), followed by Exxon Mobil ($5.6B), Pfizer ($4.6B), IBM ($2.6B), and JP Morgan ($2.6B).
Given all of the talk and authorizations, there is great expectation for the second quarter, especially from Apple, which announced a record authorization.
Share prices for Q2,’13 are running 6.3% higher than Q1,’13 and 19.3% higher than Q2,’12. This means that companies will need to spend more just to buy back the same number of shares, and spend additional funds if they wish to create share count reduction. They talked the talk, now we’ll see if they walk the walk.
(FYI – cash has again set a new record, be it by 0.17% gain)
The posts on this blog are opinions, not advice. Please read our Disclaimers.
After two months of deflation, headline CPI (Consumer Price Index) gained 0.1% in May, marking its second positive reading in at least the past seven months. Over the past 12 months, CPI inflation is up 1.4%, accelerating from April’s 1.1% reading. http://www.bls.gov/news.release/cpi.nr0.htm
Historically, commodities as an asset class have had positive correlation to inflation. In the past 10 years, using yoy% (year-over-year) monthly return data from 1/2003-12/2012, the DJ-UBS CI has had correlation of 0.64 to CPI yoy Index and the S&P GSCI has had correlation of 0.74 to CPI yoy Index. This is because commodity indices reflect our changing expectation of future prices by including futures contracts as constituents. Further, since food and energy are major components of the CPI and are among the most volatile of inflation, they are the key drivers of the indices.

Commodity index investments may provide a levered response to inflation. In other words, one dollar of commodities may hedge more than one dollar of the portfolio from inflation. This concept is called inflation beta. Historically from 1992-2012 for every 1% increase in CPI, the S&P GSCI has had a 16.0% increase and the DJ-UBS CI has had a 10.2% increase. (It is like stock beta, where if stock XXX increased 2% if for every 1% increase S&P 500, then the beta would be 2.)

Last, please click here to watch a special video on commodities and inflation from our Index Matters Series with Bob Greer of PIMCO and Boris Shrayer from Morgan Stanley.
On April 15, 2013 the S&P GSCI Precious Metals dropped 9.6% in one day, entering a bear market from the 2013 high occurring on January 23. Since then, the index has fallen further to hit its lowest level of 1733.52 since October 1, 2010 when it was at 1717.53. The precious metals index is down 20.1% YTD, and is off 21.3% from its 2013 peak of 2202.41.
Uncertainty ahead of the Federal Reserve meeting may be causing gold investors to fear whether the Fed will signal the end or a reduction to the quantitative easing.
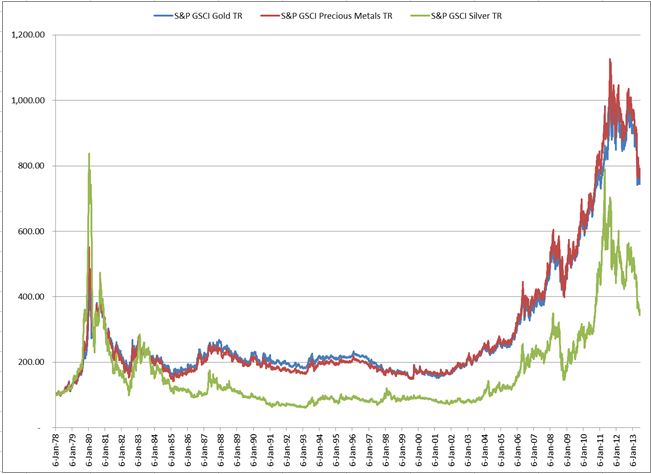 Source: S&P Dow Jones Indices. Daily data from 1/6/78 – 6/18/12. Charts and graphs are provided for illustrative purposes only. Indices are unmanaged statistical composites and their returns do not include payment of any sales charges or fees an investor would pay to purchase the securities the index represents. Such costs would lower performance. It is not possible to invest directly in an index. Past performance is not an indication of future results. The inception date for the S&P GSCI was May 1, 1991, at the market close. All information presented prior to the index inception date is back-tested.
The posts on this blog are opinions, not advice. Please read our Disclaimers.

The Federal Open Market Committee — the Fed’s policy making unit — meets today and tomorrow. Recent reports show the economy expanding, but not accelerating. Housing starts and consumer prices both slightly weaker than expected in today’s reports. Given this and recent misplaced fears that the Fed was about to end QE3, most analysts look for little change in Fed policy combined with some comments meant to end worries about a quick end to current policy.
Separately, President Obama made remarks in an interview reported by Bloomberg and by the Wall Street Journal suggesting that Fed Chairman Bernanke will step down at the end of his current term in January 2014. Almost every economist who has served in the Obama administration or worked at the Fed in the last few years is being mentioned as a replacement — in other words, no one knows who might be chosen. However, given the current soft economic recovery and Bernanke’s success at the Fed, a new Fed chairperson is not likely to make a dramatic shift in policy.
The posts on this blog are opinions, not advice. Please read our Disclaimers.