Get Indexology® Blog updates via email.

In This List

Considering Tax Diversification Benefits of Roth Accounts May Be Timely

Tail Hedging a High Yield Bond Portfolio With VIX® Futures

A Look Inside the S&P Green Bond Select Index

Rieger Report: Munis Show Their Power in Low Rate Environment

A Quick Performance Check on U.S. Preferreds

Considering Tax Diversification Benefits of Roth Accounts May Be Timely

Contributor Image
Philip Murphy

Former Managing Director, Global Head of Index Governance

S&P Dow Jones Indices

The S&P 500® was up 22.1% YTD as of Dec. 19, 2017 (including reinvested dividends), and international stocks were generally even more kind to USD investors (S&P Global Ex-U.S. BMI Gross Total Return [USD] was up 26.3% YTD). However, in most types of accounts we do not get to keep gross returns. Capital gains and dividends are sheltered from immediate taxation in traditional retirement accounts, such as 401(k)s, but are ultimately taxed at (presently unknown) future income tax rates.

Retirement savers must consider an extremely long horizon, encompassing career-long wealth accumulation as well as in-retirement decumulation. Diversifying account types in order to help manage future income tax liabilities may be worthwhile, especially considering that new federal income tax legislation is expected to significantly add to the nation’s outstanding debt and may also exacerbate income inequality. These two catalysts could eventually produce a political or economic reaction that could result in significantly higher income tax rates down the road.

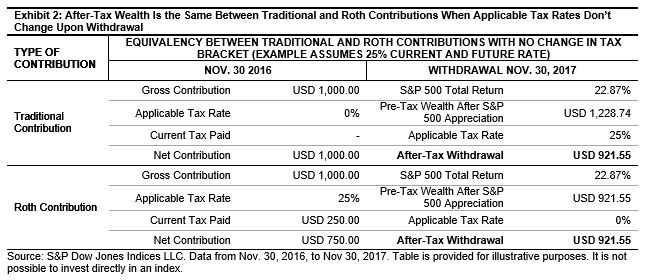
If it were known with certainty that neither the income tax code nor one’s tax bracket would change, it would make no difference in final wealth whether one made traditional tax-deductible contributions or non-tax-deductible Roth contributions. For most people, it is a safe assumption that before-tax income is likely to be lower during retirement than when they worked. So in the context of stable tax law, traditional tax-deductible contributions make sense. But because future tax law is not known, the trade-off between making traditional or Roth contributions is about hedging one’s bets with respect to future tax liabilities.

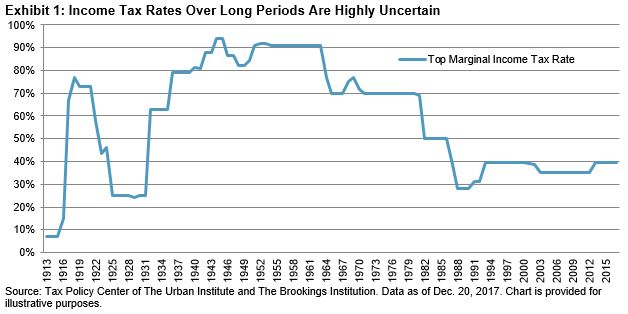
The lower current marginal income tax rates become, the less valuable current income tax deductibility is and the more valuable locking a future tax rate of 0% through the use of Roth accounts is. Currently, rates are heading lower in the short term, but in the longer term, they may need to revert back to prevailing levels or higher. For retirement savers, this represents a significant potential future liability as they draw down traditional retirement savings. The size of the liability is not known because future tax law is not known.

Some retirement plan participants have access to Roth 401(k) accounts, while others may be able to contribute to Roth IRA accounts. The general consensus is that contributing enough into a traditional or Roth 401(k) to get a company match is a good idea. Beyond that, one may want to give some thought to diversifying account types. Because they are not taxableRothupon withdrawal, Roth accounts are not subject to required minimum distributions. That makes them ideal for providing some flexibility when managing income taxes during retirement.

The posts on this blog are opinions, not advice. Please read our Disclaimers.

Tail Hedging a High Yield Bond Portfolio With VIX® Futures

Contributor Image
Hong Xie

Former Senior Director, Global Research & Design

S&P Dow Jones Indices

In one of my previous blog posts, we demonstrated that high yield bonds exhibited a strong negative correlation with VIX and an even stronger one with VIX futures, which comes mostly from down markets. This prompted us to think that VIX futures may hold tail-risk hedging opportunities for high yield bond portfolios. In this blog, we explore allocating VIX futures to tail hedge a high yield bond portfolio, with back-tested results for the following two hedging strategies.

  1. Static allocation: Allocating a static weight of x% to VIX futures in a bond portfolio.
  2. Dynamic allocation: Allocating a fixed percentage (x%) of the portfolio to VIX futures according to the observed VIX spot level. At each month’s end, if the VIX spot is equal to or greater than 25, x% of the portfolio is allocated to VIX futures the next month. If the VIX spot at month’s end is less than 25, the allocation to VIX futures is 0.

Exhibit 1 shows risk, return, and drawdown figures for a high yield bond portfolio with allocation to VIX futures ranging from 0 to 100%.  On volatility alone, both static and dynamic allocation of VIX futures can help reduce portfolio volatility, as long as the VIX futures allocation is kept under 20%. Allocating more than 20% to VIX futures proved to overhedge the bond portfolio and introduce VIX as a new risk factor that can raise portfolio volatility as allocation increases.

On the return side, dynamic allocation to VIX futures can also improves portfolio returns when the allocation is kept under 20%. In comparison, static allocation to VIX futures can significantly drag down portfolio return, as rolling VIX futures tends to incur costs. Risk-adjusted return, as measured by the ratio of return over volatility, is optimized when VIX futures are dynamically allocated at 12%.

Exhibits 2 and 3 show the cumulative returns and performance statistics of a high yield bond portfolio with and without a VIX futures allocation of 12%. Dynamic allocation to VIX futures can provide downside protection and lessen portfolio drawdown—for example, during   the market turmoil of 2008, 2009, and 2011—while adding extra return to the bond portfolio. Return per unit of risk improved from 0.83 to 1.24 for the dynamic allocation strategy.

Though static allocation of VIX futures can reduce portfolio volatility and offer downside protection compared with the broad-based, unhedged S&P U.S. High Yield Corporate Bond Index, it can drag down portfolio performance significantly, due to the high cost of rolling VIX futures.

Our back-tests have confirmed the potential benefit of a dynamic allocation to VIX futures in a high yield bond portfolio. Furthermore, we found that the risk-adjusted returns of the portfolio, as measured by the ratio of return over volatility, were optimized at the VIX futures allocation of 12% with our allocation algorithm.

The posts on this blog are opinions, not advice. Please read our Disclaimers.

A Look Inside the S&P Green Bond Select Index

Contributor Image
Dennis Badlyans

Former Associate Director, Global Research & Design

S&P Dow Jones Indices

In a previous post, “Rising Above the Noise in ESG: Green Bonds,” we argued that green bonds provide a simple way to add an element of environmental investing into core fixed income holdings. In this blog, we take a closer look at the composition of the S&P Green Bond Select Index and show that it can also help diversify exposure away from global treasuries and add much-needed exposure to infrastructure bonds.

The S&P Green Bond Select Index can help diversify core fixed income exposure away from treasuries. With the exception of mortgage pass-through securities, the green bond market has diversified to include bonds from the major core segments of the global fixed income universe. Despite the diversity of bond types in the green market, the mix of assets is different than the Bloomberg Barclays Global Aggregate Bond Index. Aside from the difference in mortgages, the biggest difference between the two is in the treasury component. As of Dec. 15, 2017, there were just two central government bonds issued in the green market, and they both qualified for the S&P Green Bond Select Index—a local government bond (treasury) issued by France, which accounted for about 6.2% of the investable index, and a sovereign bond issued by Poland in Euros. In contrast, the treasury and sovereign components of the Bloomberg Barclays Global Aggregate Bond Index totaled 55% (see Exhibit 1). Some market participants have been looking for a way to diversify away from treasuries, and green bonds may be one opportunity to do this.

Agencies, supras, and local authorities account for the lion’s share of the S&P Green Bond Select Index, representing 60% of the index as of Dec. 15, 2017, down from 70% in December 2015 and 90% in December 2013 (see Exhibit 2). Corporates, utilities, and commercial banks have accounted for at least one-half of the gross supply over the past two years.

Aside from differences in composition, there is a fundamental distinction in the nature of the assets that market participants should take note of. By nature, green bonds are issued to provide financing to help with the transition to a low-carbon economy. The use of proceeds can range from financing consumer auto loans and leases for electric cars to large national infrastructure projects.

One recent example of a large-scale infrastructure investment opportunity is the bonds issued by the Mexico City Airport. The new international airport is one of the largest public infrastructure works in a century. Total funding required is about USD 13.3 billion, with 60% coming from the federal government. In September 2017, the airport trust issued USD 4 billion in green bonds, adding to the USD 2 billion issued in 2016. Broadly across emerging markets, there is an extensive demand for financing infrastructure, and with the evolving need to build it with an eye on sustainability and carbon efficiency, one might expect a shift in issuance to the green market.

Despite the differences highlighted, the two indices are relatively similar in terms of characteristics. As of Dec. 15, 2017, the two indices were relatively similar with respect to credit quality, duration, and yields. We highlight again that since the launch of the S&P Green Bond Select Index on Feb. 17, 2017, its performance has been highly correlated to the Bloomberg Barclays Global Aggregate Bond Index. In fact, over the same period, the S&P Green Bond Select Index has outperformed, returning 3.5% more than the Bloomberg Barclays Global Aggregate Bond Index.

For a further look at this topic, watch A Look Inside the S&P Global Green Bond Index.

If you enjoyed this content, join us for our Seminar Discover the ESG Advantage in
London on May 17, 2018.

The posts on this blog are opinions, not advice. Please read our Disclaimers.

Rieger Report: Munis Show Their Power in Low Rate Environment

Contributor Image
J.R. Rieger

Former Head of Fixed Income Indices

S&P Dow Jones Indices

The 2017 low interest rate environment has created a wonderful example of the power of tax-exempt bonds. On a nominal return basis, investment grade corporate bonds tracked in the S&P 500 Investment Grade Corporate Bond Index have outperformed tax-exempt bonds tracked in the S&P National AMT-Free Municipal Bond Index. By considering the tax implications, using tax rate assumptions, the power of tax-exempt municipal bonds becomes evident. After all keeping more of the return is more important than the nominal return!

Chart 1 shows the returns broken down in price return (gains) and interest return. No attempt was made to address Original Issue Discount (OID) bonds which also have tax advantages regarding price appreciation.

Chart 1: Year-to-Date Returns of Select Investment Grade Bond Indices:

Viewing the returns of both asset classes, corporate and municipal bonds, from the perspective of returns after taxes reverses the trend. It is important to note that this analysis is just illustrative and is based on tax rate assumptions.

Chart 2: Year-to-Date Returns of Select Investment Grade Bond Indices After Federal Tax Rate Assumptions are Applied:

Taking the assumptions one step further, I looked to find what federal tax rate assumption on capital gains and interest income would be required for investment grade corporate bonds to return approximately the same return as tax-exempt municipal bonds from an after tax basis. Chart 3 illustrates the result: 15%. To me that means tax-exempt municipal bonds may have value for a wider investor base beyond the highest tax brackets.

Chart 3: Year-to-Date Returns of Select Investment Grade Bond Indices After Applying a 15% Federal Tax Rate Assumption:

The posts on this blog are opinions, not advice. Please read our Disclaimers.

A Quick Performance Check on U.S. Preferreds

Contributor Image
Kevin Horan

Former Director, Fixed Income Indices

S&P Dow Jones Indices

There are only a couple weeks to go until the end of the year, and for a while now, the investing public has seen plenty of material supporting the benefits or risks of diversifying a portfolio through the use of preferred securities. This hybrid type product touts the benefits of high yields, steady income, and a more senior status in the capital structure when compared with common stock.

When comparing the asset classes that the preferred hybrid securities sit between, it is noticeable that the preferred class (as measured by the S&P U.S. Preferred Stock Index) has had a higher total return than bonds (as measured by the S&P 500® Bond Index), but not nearly as much as equity (as measured by the S&P 500). What needs to be kept in mind about this is that the volatility of returns as measured by standard deviation is much lower for bonds (0.19) and preferreds (0.21) than it is for equity (0.43). Thus, preferreds tend to be a reliable stream of income that yields more than bonds, but it can also be used as a diversifier since the correlation of returns between bonds and preferreds is low.

Exhibit 1: Preferreds Versus 500 Stocks and 500 Bonds

Source: S&P Dow Jones Indices LLC. Data as of Dec. 18, 2017. Past performance is no guarantee of future results. Table is provided for illustrative purposes.

Dissecting the S&P U.S. Preferred Stock Index through the use of subindices can provide exposure to the differing components that make up the parent index. A quick comparison shows that investment-grade preferreds have outperformed high-yield and non-rated preferreds, as well as the parent index.

Exhibit 2: Preferred Ratings Indices Comparison

Source: S&P Dow Jones Indices LLC. Data as of Dec. 18, 2017. Past performance is no guarantee of future results. Chart and table are provided for illustrative purposes.

Coupon type can also provide differing exposure, as the S&P U.S. Variable Rate Preferred Stock Index (TR) returned twice the amount of the S&P 500 Bond Index, at 11.02% YTD, as of Dec. 18, 2017. It also helps to know that the S&P U.S. Variable Rate Preferred Stock Index (TR) is made up of 59% high-yield, 28% investment-grade and 12% non-rated securities.

Exhibit 3: Preferred Coupon Indices Comparison

Source: S&P Dow Jones Indices LLC. Data as of Dec. 18, 2017. Past performance is no guarantee of future results. Table is provided for illustrative purposes.


The posts on this blog are opinions, not advice. Please read our Disclaimers.