Get Indexology® Blog updates via email.

In This List

The Green-Eyed [Bond] Monster

SPIVA® South Africa: Active Equity Funds Followed the Global Trend—They Underperformed

Back to Normal...Almost

India: Market Update for Q3 2016

Water and Financial Returns—Don’t Be Hung Out to Dry

The Green-Eyed [Bond] Monster

Contributor Image
Emily Ulrich

Former Senior Product Manager, ESG Indices

S&P Dow Jones Indices

Green bonds are bonds created to fund projects with positive outcomes that are directly related to the environment.

They include the following.

  • “Use of proceeds” bonds and revenue bonds, which are designated for green projects.
  • Green project bonds, the proceeds of which are earmarked for specific projects with positive environmental outcomes.
  • Green securitized bonds, which are designated for green projects (specific or otherwise).[1]

As depicted in Exhibit 1, green bond issuance has grown significantly in recent years.

capture

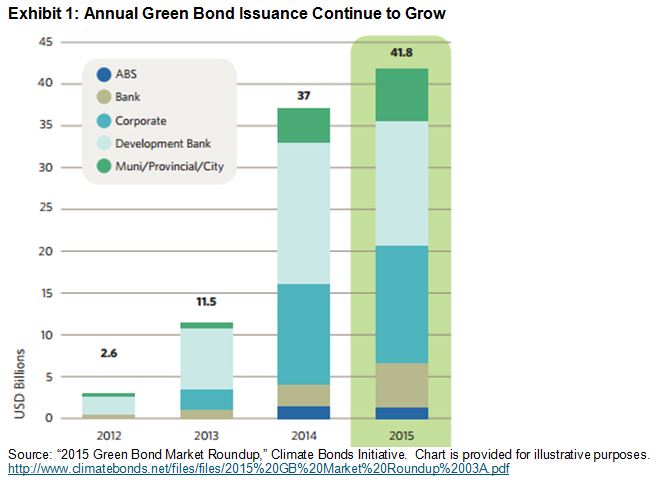
Additionally, as of the end of September 2016, green bond issuances already totaled USD 50 billion—illustrating that this rapid growth shows no signs of stopping.  This upward trajectory is likely due to a few key factors.

  • Green bonds are relatively simple and contain traditional debt—there are no specialized cash flows and no financial engineering.
  • Multiple coalitions began surrounding the green bond market in 2014, including the Green Bond Principles and three different green bond index launches (including that of S&P Dow Jones Indices). These movements helped spur the green bond market further into the spotlight and spread awareness to market participants.

Another prime example of the growth of this market is the increasing constituent count of the S&P Green Bond Index.

The S&P Green Bond Index includes any green-labeled bond, as flagged by Reuters and the Climate Bonds Initiative (CBI), which makes it a superb indicator of the green bond marketplace.

capture

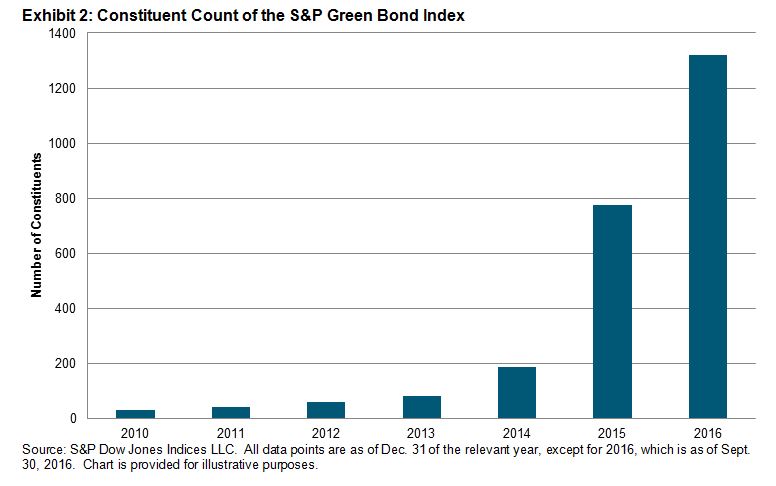
As depicted in Exhibit 2, there were 31 bonds in the index in 2010.  As of September 2016, there were 1,320.

Even with this considerable expansion, the green bond marketplace is still flawed.  As with many areas of sustainable finance, it still lacks standardization.  The CBI has standards in place, but they are non-binding and typically viewed in the marketplace as guidelines rather than hard-line standards.

However, we expect the green bond market to continue to grow.  It’s a relatively easy way for market participants to tango with green finance—a prospect even more desirable after the COP 21 “two degree” investment initiative, the G20 Summit goals, and increasing regulations surrounding divestment.

As more and more market participants engage with green bonds, it’s reasonable to expect that regulation will come naturally, as a means to standardize a fast-growing market.  After all, the first “climate awareness” bond was only launched in 2007.

[1]   “Explaining Green Bonds,” Climate Bonds Initiative.  https://www.climatebonds.net/market/explaining-green-bonds

The posts on this blog are opinions, not advice. Please read our Disclaimers.

SPIVA® South Africa: Active Equity Funds Followed the Global Trend—They Underperformed

Contributor Image
Daniel Ung

Former Director

Global Research & Design

South African equity markets have once again performed poorly, especially in comparison with global equity markets.  One reason for this drab performance was that its GDP contracted 1.2% in the first quarter, although the price of gold—one of the country’s key exports—increased and the South African rand recovered somewhat with respect to other currencies.

Poor economic news, both domestic and international, led to bouts of heightened volatility in the first half of the year, but active equity managers did not seem to be able to take advantage of this.  Across all time horizons studied, both domestic and international active equity funds underperformed their respective benchmarks (see Exhibit 1).

The results regarding fixed income were less clear.  Over the five-year horizon, active managers beat their respective benchmark in the short-term bond category but not in the diversified/aggregate bond category.

To access the full report, please click here.

capture

The posts on this blog are opinions, not advice. Please read our Disclaimers.

Back to Normal...Almost

Contributor Image
Fei Mei Chan

Former Director, Core Product Management

S&P Dow Jones Indices

It’s been a roller coaster week in the aftermath of the startling conclusion to the U.S. Presidential election on November 8, 2016.   As recently as a week before the election, equity markets were quite calm, although volatility levels recognized the possibility of a surprise Trump victory.  When that victory occurred, U.S. futures declined significantly before markets opened on November 9, only to close the day with significant gains.  But the market’s returns were not evenly distributed.  Industries thought to benefit from Trump policies were revalued upward, while those that would have benefited more from a Clinton administration went in the opposite direction.

We can view this adjustment through the lens of equity market dispersion.  S&P 500 dispersion, which measures how individual stock returns deviate from average, peaked this month on November 9 for the S&P 500. It has since leveled off and is currently almost back to its pre-election levels. It has similarly declined in Europe and Asia.  As the Trump administration begins to take shape and we learn more about its priorities and legislative agenda, future surprises are possible, and we’ve learned in the last week how rapidly market conditions can change.  For now, however, narrowing dispersion signals an end to the initial adjustment to a new market consensus.

back-to-normal-almost2

back-to-normal-almost

The posts on this blog are opinions, not advice. Please read our Disclaimers.

India: Market Update for Q3 2016

Contributor Image
Mahavir Kaswa

Former Associate Director, Product Management

S&P BSE Indices

Buoyed by a good monsoon season, an increased inflow of funds by foreign portfolio investors (FPIs), the passage of a goods and services tax (GST) bill in the upper as well as lower house, and the possibility of an interest rate cut due to low to moderate inflation, the Indian capital market posted its second-best quarterly return of the last eight quarters.  However, industrial production, as measured by the Index of Industrial Production, contracted by 2.4% in July 2016, and India’s GDP growth fell to 7.1% for the quarter ending in June 2016—its lowest level in six quarters.

The S&P BSE AllCap, India’s broad-based benchmark index that covers over 95% of India’s listed market capitalization, had a total return of 6.5% during the quarter that ended Sept. 30, 2016.  During the same time, the S&P BSE SENSEX had a total return of 3.6% (see Appendix for a market heat map and monthly total returns).  With a total return of 12.9%, the S&P BSE MidCap noted best performance among the size indices, and the S&P BSE LargeCap was the worst performer, with a total return of 4.8%.  The S&P BSE SmallCap had a total return of 8.7%. q3-2016-1

On the sector front, metal stocks (part of the basic materials sector) showed a rally, despite subdued demand in the domestic market and continued sluggishness in key export destinations.  Energy shares bucked the trend following a pickup in oil prices in recent months. The basic materials and energy sectors noted the highest total returns, of 14.2% and 15.7%, respectively.

Information technology stocks don’t appear to be out of the woods, as leading companies forecast sluggish growth and possible uncertainty due to the Brexit.  In the case of the telecom sector, despite being one of India’s largest and fastest growing sectors, it noted the worst performance during Q3 2016, due to increased pressure on tariffs after the commercial entry of Reliance Jio.  The information technology and telecom sectors declined by 8.4% and 9.2%, respectively. q3-2016-2

Outlook

A good monsoon should help boost domestic consumption and keep a check on inflation, which may help the Reserve Bank of India further reduce the interest rate.  In addition, factors such as increased inflow of funds from FPIs, the passage of a GST, and the implementation of the Seventh Pay Commission recommendations may help the market.  However, the results of the U.S. Presidential elections, geopolitical concerns, and the possibility of an increase in the interest rate are a few of the key factors to watch out for.

The posts on this blog are opinions, not advice. Please read our Disclaimers.

Water and Financial Returns—Don’t Be Hung Out to Dry

Contributor Image
Neil McIndoe

Head of Environmental Finance

Trucost

Recently, investment professionals have paid increasing attention to the impact of carbon-intensive businesses on financial returns.  Stricter regulation and increased certainty of higher carbon pricing have made this a mainstream concern.  S&P Global Ratings’ announcement of a green assessment of debt finance in September 2016 is one notable example of this trend.

Water scarcity, as a risk to business, may be less well understood, but it is arguably the nearer-term threat.  With a global population that has risen from 3 billion in 1960 to over 7.3 billion today, demand for fresh water is becoming greater than its practicable supply.  The likely result will be increasing costs.

If water were priced to reflect this scarcity, Trucost’s analysis suggests that company profits would fall by nearly 27%, on average—with certain sectors significantly more exposed (see Exhibit 1).

capture

Some companies already understand the risks and are acting to address them.  The Spanish energy company Iberdrola carefully assesses its own use of water and that of its suppliers.  Iberdrola details all of its supply chain’s water-related risks from a likelihood, financial-impact, and geographic-location perspective.  Unfortunately, most companies do not pursue this level of risk management, so market participants may need to take the initiative to make sure they are not “hung out to dry,” so to speak.  That may mean encouraging the companies they invest in to measure and disclose relevant water risks.

A number of larger and more sophisticated market participants are already doing this.  A typical approach is to focus on certain sectors, identify material issues, and analyze company reporting on these risks, along with mitigation strategies.  Trucost recently completed such an exercise for 120 global utility companies.  The study found that the majority (approximately 55%) were not addressing water-related risks in a meaningful way.  Only 5% of the companies provided robust reporting on how water risks are managed within their operations and along their supply chain.  About 20% of the companies did have targets to reduce water consumption and usage intensity or increase water recycling.  However, many of the targets did not specify a base year or even  a target year.

For those market participants not yet looking at water risk, how should they begin to consider it alongside other risk management considerations?

The first step could be to create a water footprint of equity holdings to identify water-intensive companies, based on either  direct use or supply chains.  The second step would be to encourage these companies to report adequately on their water dependency and ability to manage associated risks.  Ceres, a U.S.-based coalition of market participants, has produced “Aqua Gauge,” which is a framework for assessing corporate management of water risk.

There is significant legislation already, such as the EU Water Directive, and much more is on the way that seeks to bring about adequate water pricing as an incentive for the sustainable use of water resources.  Market participants that consider water risk may encourage better company performance, better financial returns, and a better environment in which to enjoy them.

The posts on this blog are opinions, not advice. Please read our Disclaimers.