Get Indexology® Blog updates via email.

In This List

Growth and Surging Popularity of Unconstrained Bond Funds

Expect more starting and stopping at the Fed on Interest rates.

Rieger Report: Puerto Rico bonds fall after moves to suspend debt payments

Necessary, but not sufficient

Every Commodity Benefits From A Falling Dollar

Growth and Surging Popularity of Unconstrained Bond Funds

Contributor Image
Hong Xie

Former Senior Director, Global Research & Design

S&P Dow Jones Indices

In the aftermath of the global financial crisis of 2007-2008, one noticeable trend in fixed income investment is the growth and popularity of unconstrained bond funds.  They have generated strong interest in the investment industry due to the flexibility they offer in duration management and the broader investment universe.  Because they are not managed against a specific benchmark, unconstrained bond funds may also pose challenges for investors in understanding and measuring their performance.

The global financial crisis of 2007-2008 and the economic recession that followed prompted unprecedented quantitative easing monetary policies across many countries.  Not only were short-term interest rates lowered to either zero or close to zero, but quantitative easing was also adopted in places such as the U.S., the U.K., the eurozone, and Japan to flatten the yield curve and keep long-term interest rates low.  As the U.S. economy continues to recover and the Fed starts to increase interest rates, many investors have concerns about holding core fixed income products with high interest-rate risk in a rising-rate environment.  It is this widespread market sentiment that has driven the surging popularity of unconstrained bond funds, which offer wide latitude to fund managers on duration management and investment selection.

We use fund data from Morningstar to gauge the size and growth of unconstrained bond funds.  In particular, we screen for funds categorized as “U.S. OE Nontraditional Bonds” by Morningstar, while excluding those with mandates in specific sectors or with duration constraints.

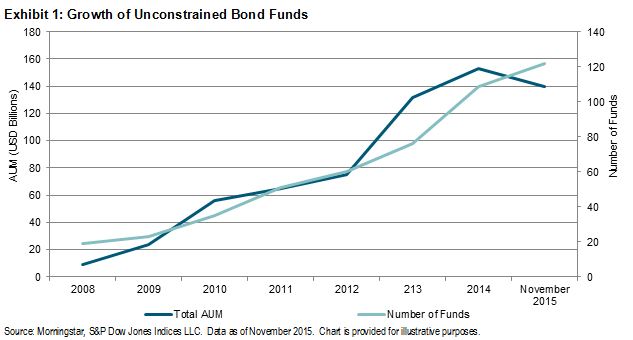
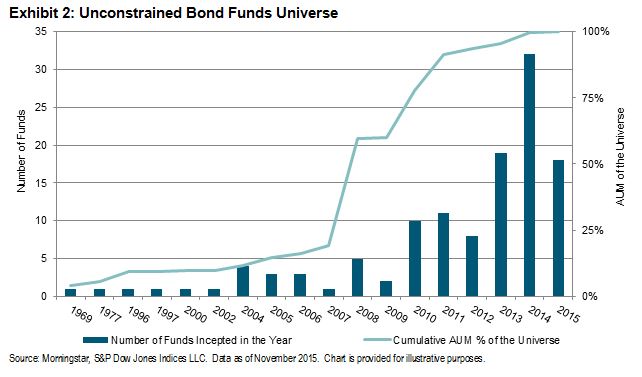
As of November 2015, there were 122 open-ended mutual funds with total assets under management (AUM) of USD 140 billion in our data set, in comparison with 19 funds with AUM of USD 9 billion at the end of 2008 (see Exhibit 1).  Even though the first fund started in 1969, it wasn’t until after the global financial crisis of 2007-2008 that unconstrained bond funds started gaining traction among investors.  Exhibits 1 and 2 show the rapid growth of unconstrained bond funds since 2008 in terms of both AUM and number of funds.

CaptureCapture

The posts on this blog are opinions, not advice. Please read our Disclaimers.

Expect more starting and stopping at the Fed on Interest rates.

Contributor Image
David Blitzer

Former Managing Director and Chairman of the Index Committee

S&P Dow Jones Indices

Given the FOMC minutes released yesterday we expect to see two rate increases in 2016. The next move is likely to be in June, not at the April 27th meeting. Some analysts blame disagreements within the Fed for what they see as inconsistent and changing policy.  While it is difficult to anticipate short term market volatility, not paying attention to those market gyrations would be a mistake.  This year began with sharp drops in the S&P 500 and Treasury notes and a spike in VIX (see chart).  Had the Fed stuck to the plan it hinted at in December and pushed rates up in late January, it would have put stocks into a correction and spooked the economy. Instead it changed its mind when the data changed.

Unexpected bouts of market turmoil aren’t likely to end anytime soon. Moreover, few investors would want the Fed to ignore market events and steam-roller through rates hikes on a pre-set schedule.  Whether the FOMC raises interest rates at its meeting in June, or later in the year, depends on the Fed’s view of the economy and how volatile the markets are at that moment.

We can look past the uncertainty of short term volatility and examine the Fed’s longer term outlook to discern the likely path of interest rates. The Fed expects the US economy to continue growing with real GDP growth of 2.25% in 2016 and 2017, slowing slightly to about 2% in 2018. The unemployment rate is anticipated to drop from the current 5.0% rate to about 4.65% in 2016 and 2017.  Inflation projections show some changes. The core PCE inflation rate is expected to rise from 1.5% this year to about 1.8% in 2017 and 1.95% in 2018.  The increase in the overall PCE rate – including volatile food and energy components  — is from about 1.4% in 2016 to 1.9% or 2.0% in 2017 and 2018.  The inflation numbers tell the story – the Fed is expecting inflation to rise to its 2% target over the next year or two. Given the associated drop in the unemployment rate, there will be a gradual increase in the Fed funds rate.  The FOMC’s own projection for the Fed funds rate is to pass 2% in 2017, pass 3% in 2018 and settle at 3.5% in the long run.  Given 2% inflation in the long run, the real rate of interest would be about 1.5%.

Looking forward, interest rates will rise over the next year and a half. Progress could be slowed if the market gyrations that opened the year repeat; or the rise could come sooner if growth picks up and stock prices climb without interruption.  Of course, smooth sailing is not guaranteed.  What could go wrong?  For the rest of 2016 the risks are focused on the down-side: weakness in China, volatility in financial markets, fallout from Europe or Brexit or something unexpected that would slow US growth and push up unemployment. There is always some risk of recession. If the economy turns seriously down, the Fed is likely to respond by cutting interest rates back to zero, considering a return to QE or possibly joining the negative interest rate club.  The recession risk is also a motivating factor behind the Fed’s efforts to raise interest rates: today rates are one step from the bottom so any rate cut to support the economy would be small. Were the interest rates at 2%, the Fed could cut rates farther is necessary.

If the economy develops as the Fed expects the risk of higher inflation will increase over time. Given the difference between core PCE and total PCE, the Fed is expecting oil prices to rise in the next 12 months.  Add the momentum from rising oil prices to the decline in the unemployment rate and there is some probability that inflation could move over the 2% target to 3% or 4%.  Were that to happen, the Fed would likely move aggressively to raise interest rates and dampen inflation

The posts on this blog are opinions, not advice. Please read our Disclaimers.

Rieger Report: Puerto Rico bonds fall after moves to suspend debt payments

Contributor Image
J.R. Rieger

Former Head of Fixed Income Indices

S&P Dow Jones Indices

The governor of Puerto Rico has moved forward with a bill to suspend debt payments while looking for Washington to help.  The muni market reacted dragging the General Obligation bonds down further.  The S&P Municipal Bond Puerto Rico General Obligation Index has dropped over 3% in April so far and over 5.8% year-to-date.

Municipal high yields bonds tracked in the S&P Municipal Bond High Yield Index have risen over 2.1% year-to-date, the same index excluding Puerto Rico bonds is up over 3% year-to-date.

Table 1) Selected municipal bond indices and their returns:

Source: S&P Dow Jones Indices, LLC. Data as of April 6, 2016.

The posts on this blog are opinions, not advice. Please read our Disclaimers.

Necessary, but not sufficient

Contributor Image
Tim Edwards

Managing Director, Index Investment Strategy

S&P Dow Jones Indices

In the popular imagination, “big business” is responsible for climate change.  In fact, corporate emissions of greenhouse gasses are a small part of the problem; it is quite possible that corporations also provide our best hope for a solution.

The current reality – what we know to be true – is that governments worldwide are shortly expected to commit to limit their emissions of greenhouse gasses, sufficiently for the global average temperature to rise no more than 2° C above pre-industrial levels.  While the world’s political leaders have been quick to advertise their commitment to this laudable goal, they have so far been reticent in explaining exactly what might be required to meet it.

According to the U.N., the world produced around 37 gigatonnes (Gt) of greenhouse gasses in 2015.  Scientists estimate we can produce roughly another 1,000 Gt of further emissions in total and yet remain within the 2° C limit.  If we allow ourselves 100 years to come up with a technological solution, that implies an annual budget of 10 Gt per year; an annual reduction of around 27Gt.

In context, the world’s blue chip corporations – identified via their inclusion the S&P Global 1200 – account for around 5.2 Gt per annum in aggregate.  A change to corporate emissions patterns may be necessary, but it will not be sufficient.

GG Up

Moreover, as we have indicated, the existence of a non-zero “target” for near-future greenhouse gas emissions is predicated on the future discovery of alternative technologies, capturing and removing carbon from the atmosphere or replacing our energy sources (and allowing, in our example, for the budget to last only 100 years).  More aggressively, several proposals for emissions targets assume a pace of discovery that results in negative net emissions during the second half of this century.  Venturing briefly into the realm of speculation, it seems rather likely that the actions of large corporations seeking new and cleaner sources of energy will be critical in developing the technology and infrastructure to support it.

The conversation around climate change has a propensity to become mired in polemic, politics, and accusations of bad faith.  This is a shame.  It is quite possible to examine the current trends in the light of objective and impartial data.  Through the range and scope of our indices, S&P Dow Jones Indices can provide data on where the impact might be felt, and which investment styles may benefit.  Such analysis of the make-up, importance and distribution of corporate emissions is provided in our latest paper: the S&P Dow Jones Indices Carbon Emitter Scorecard.


The posts on this blog are opinions, not advice. Please read our Disclaimers.

Every Commodity Benefits From A Falling Dollar

Contributor Image
Jodie Gunzberg

Former Managing Director, Head of U.S. Equities

S&P Dow Jones Indices

For the first time since June 2014, the Dollar Spot Index yoy% was negative in March. That was one of the main reasons commodities had such a strong month with the S&P GSCI gaining 4.9% and Dow Jones Commodity Index (DJCI) up 4.0%. Since commodities are priced in US dollars, when the dollar rises, it hurts commodities.

Source: S&P Dow Jones Indices and Bloomberg.

However, not all of the commodity market demise can be blamed on the the strength of the US dollar. Historically in the past 10 years, there is a -0.60 correlation between the rising dollar and commodities, meaning the relationship is negative but not very strongly. More importantly, when the dollar rose year-over year, it increased on average 8.1% driving commodities down 7.0% on average. While some economically sensitive commodities are moved more by the rising dollar, especially in energy, many are less sensitive and some even rise with a rising dollar.

Source: S&P Dow Jones Indices.
Source: S&P Dow Jones Indices. For every 1% move up for the dollar, the up $ market capture ratio measures how much each commodity moves. For example, if the dollar rose 1%, nickel fell 1.907%. When the dollar rose 1%, feeder cattle rose 0.746%.

When the dollar rises, it is possible some opportunistic buying happens to take advantage of cheaper commodities, helping the prices from falling even further. On average the up $ market capture ratio for the commodities is -87.2, meaning for every 1% the dollar rose, commodities on average fell 0.872%.

Now that the dollar has started to fall, it is interesting to note how much more power a falling dollar has in boosting commodities than a rising one hurts. On average when the dollar fell it fell 6.5% year-over-year, pushing commodities up on average 25.5%. The average down $ market capture ratio for commodities is -393.2, meaning for every 1% the dollar fell, commodities on average rose 3.932%. The falling dollar is 4.5 times more powerful than the rising one on commodities. Plus every single commodity benefits from the falling dollar, with the metals gaining most.

Source: S&P Dow Jones Indices.
Source: S&P Dow Jones Indices. For every 1% move down for the dollar, the down $ market capture ratio measures how much each commodity moves. For example, if the dollar fell 1%, lead rose 7.154%. When the dollar fell 1%, natural gas rose 0.687%.

Not only does every single commodity benefit from a falling dollar, but only natural gas gets hurt more by a rising dollar than it gets helped by a falling one. It may be since it is so difficult to store.

Source: S&P Dow Jones Indices.

If the Fed continues its more dovish sentiment, the dollar may fall more, which could be highly beneficial for commodities.


The posts on this blog are opinions, not advice. Please read our Disclaimers.