The recent turmoil in the Chinese market has taken the global market on a turbulent ride since the beginning of 2016. India was no exception. During the first two weeks of 2016, the S&P BSE SENSEX lost almost 6.37%, making some investors jittery. Foreign investors took out almost INR 34.84 billion from the Indian stock market, while mutual funds added close to INR 28.18 over the same time period. While the broader stock market suffered a huge draw down through January 15, 2016, let’s see how a new series of factor based indices that were recently launched by Asia Index Private Limited fared over the same time frame based on back-tested data.
A high-level summary of the characteristics of these indices is as follows.
- All four of the factor based indices include 30 stocks from the S&P BSE LargeMidCap. The constituents differ depending on the rules of the index.
- The S&P BSE LargeMidCap is a size sub-index of S&P BSE AllCap. Its methodology is designed to cover approximately 85% of the total market cap of the S&P BSE AllCap and is a float-market-weighted index.
- The S&P BSE Enhanced Value Index consists of “best value” stocks according to a proprietary methodology. “Value” is measured using the price-to-book, price-to-earnings, and price-to-sales ratios of companies.
- The S&P BSE Low Volatility Index consists of the least-volatile stocks measured over a one-year period.
- The S&P BSE Momentum Index consists of the stocks within the S&P BSE LargeMidCap with the highest momentum measured over a one-year period. Momentum is measured as risk-adjusted price performance over time.
- The S&P BSE Quality Index consists of the “highest quality” stocks according to a proprietary methodology. Quality is measured using the return-on-equity, financial leverage, and accrual ratios of companies.
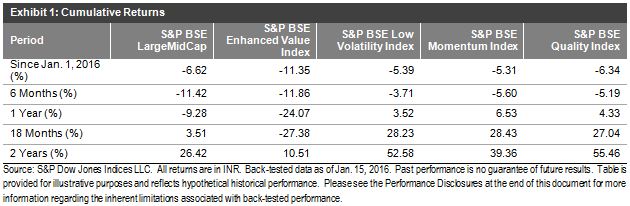
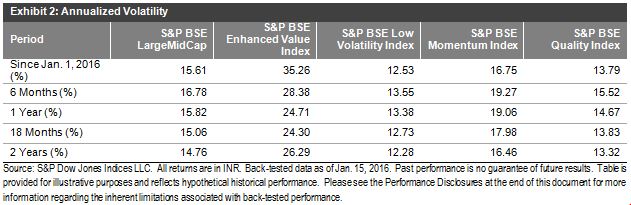
Over the past two years ending Jan. 15, 2016, the S&P BSE Quality Index had a cumulative total return of 55.46%, which was the highest among the four factor indices (see Exhibit 1). It was followed by the S&P BSE Low Volatility Index, which had a cumulative total return of 52.58%. Over the same period, the S&P BSE Enhanced Value Index performed lower than the S&P BSE LargeMidCap. While the S&P BSE Quality Index and the S&P BSE Low Volatility Index displayed lower volatility in comparison with the S&P BSE LargeMidCap (see Exhibit 2), the S&P BSE Enhanced Value Index was 80% more volatile than the S&P BSE LargeMidCap over the same two-year period.
Over the past one-year period ending Jan. 15, 2016, the S&P BSE Low Volatility Index, the S&P BSE Momentum Index, and the S&P BSE Quality Index were in the black, even though the S&P BSE LargeMidCap ended in the red (see Exhibit 1). The S&P BSE Low Volatility Index and the S&P BSE Quality Index even displayed lower volatility than the S&P BSE LargeMidCap (see Exhibit 2). Over the same period, the S&P BSE Enhanced Value Index lost 24%, which was more than two-times the decline suffered by the S&P BSE LargeMidCap (see Exhibit 1).
During the six-month period ending Jan. 15, 2016, all of the indices delivered negative performance (see Exhibit 1). The S&P BSE Enhanced Value Index remained the most volatile and suffered the largest decline of the four of the factor based indices (see Exhibit 2).
Overall, the markets have been in the bear mode, and we can notice that factor based indices displayed their own risk/return characteristics.
The posts on this blog are opinions, not advice. Please read our Disclaimers.