The yield-to-worst of the 10-Year U.S. Treasury has been dancing around 2% and dipped below 2% in intraday trading on Jan. 15, 2016. The night before, the S&P/BGCantor Current 10 Year U.S. Treasury Bond Index closed at 2.09%. The average yield of the 10-year for 2015 was 2.13%, while 2016 began at 2.30% for the index. Since the beginning of the year, yields have headed lower and are now equivalent to levels seen in October 2015.
Post-Fed rate increase and halfway through the first month of 2016, Treasuries prices have increased, as some investors have moved toward safe haven assets in response to concerns over dangers in the U.S. economic recovery, which have been brought on by possible credit problems in energy and commodity companies due to the low price of oil.
Also contributing to the move would be the recent Chinese currency devaluation, a selloff in Chinese stocks, and lower Chinese demand of commodities, possibly leading to downward risk in inflation levels.
News from China added to other global issues, such as continued European economic stimulus, the threat of terrorism, and languishing global inflation, point to yields possibly remaining lower in 2016 before going higher.
Exhibit 1: S&P/BGCantor Current 10 Year U.S. Treasury Bond Index Yield-to-Worst
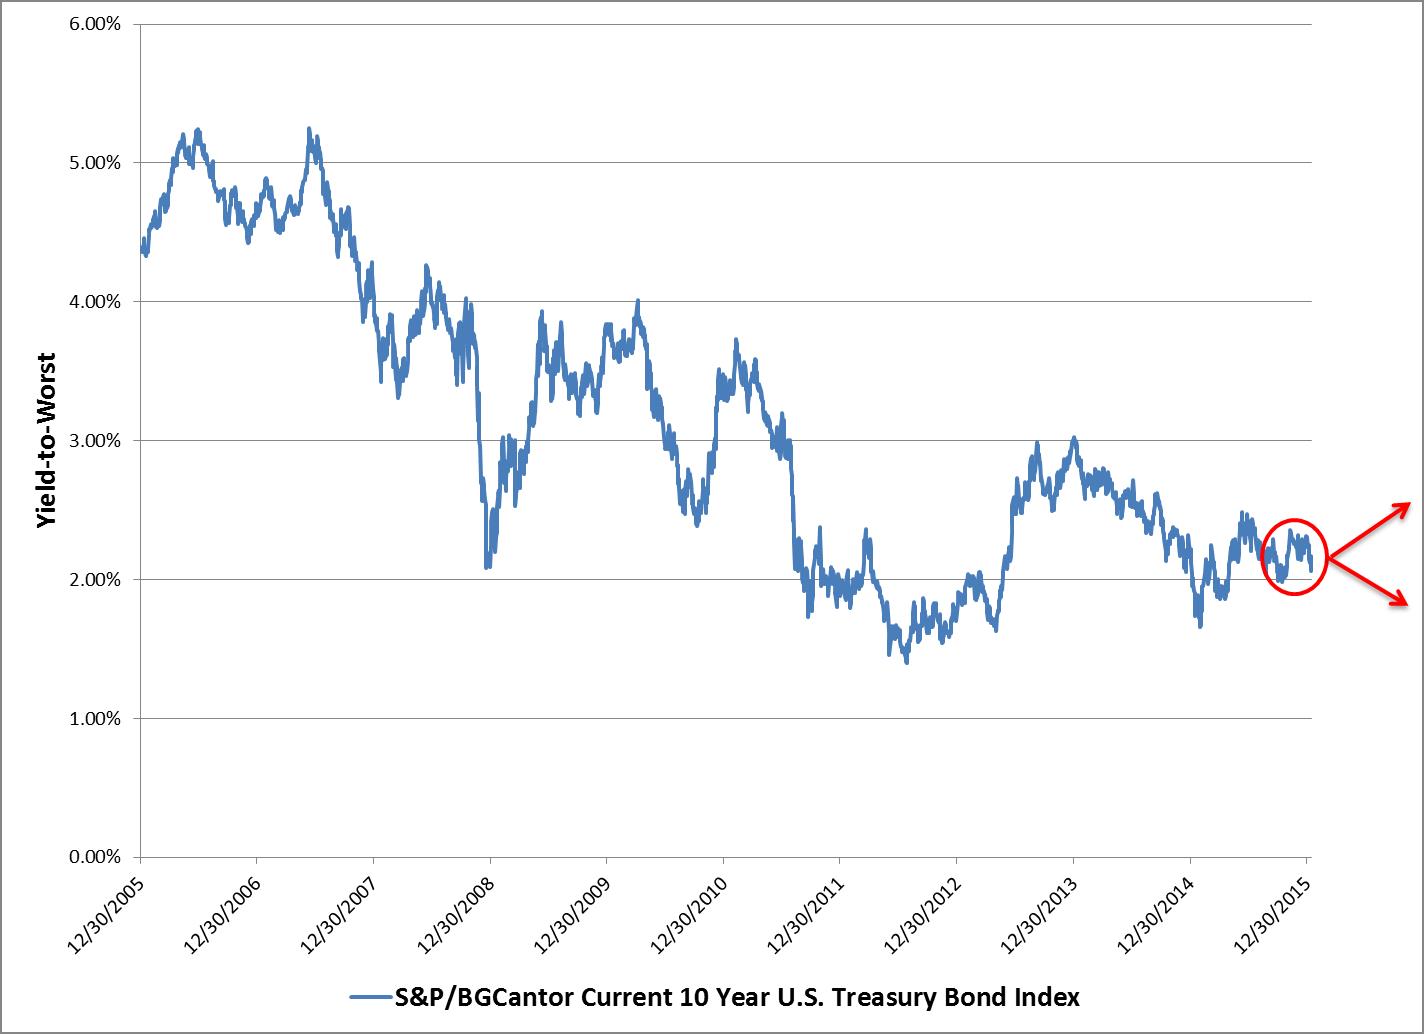
Source: S&P Dow Jones Indices LLC. Data as of Jan. 14, 2016. Past performance is no guarantee of future results. Chart is provided for illustrative purposes.
The posts on this blog are opinions, not advice. Please read our Disclaimers.